OEE Monitoring Software

STOP DEBATING THE NUMBER.
START ACTING ON IT.

OEE that names the dollar figure and the machine event behind it, routed to whoever can do something about it before the shift ends.
OEE Hero-1

TRANSFORM YOUR DATA
FROM INSIGHT INTO ACTION.

Start delivering the right information to the right person at the right time so you can capitalize on the opportunity to improve while there's still time.

Three inputs, each traceable to its source.

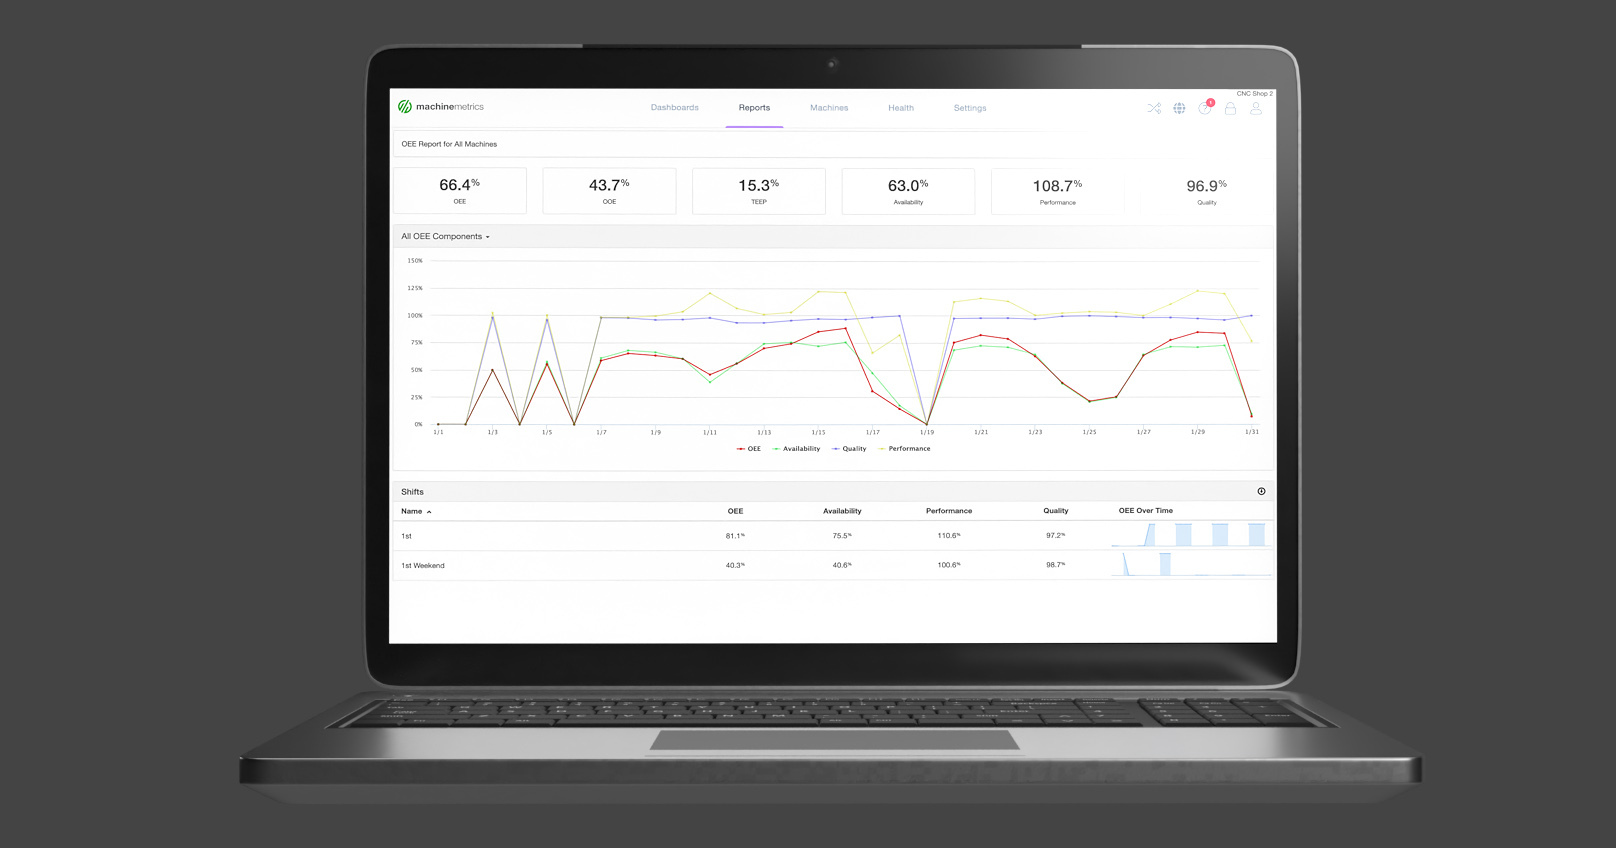
Availability comes from machine schedules that carry your real shifts, breaks, and holidays. Performance compares actual cycle time to the ERP standard for that part, matched automatically — or baselined from observed production where no standard exists. Quality comes from operator scrap plus external sources like probing and CMM data. Utilization, OOE, TEEP, and Parts Goal calculate alongside. Every number traces to its input.
stats and cycles

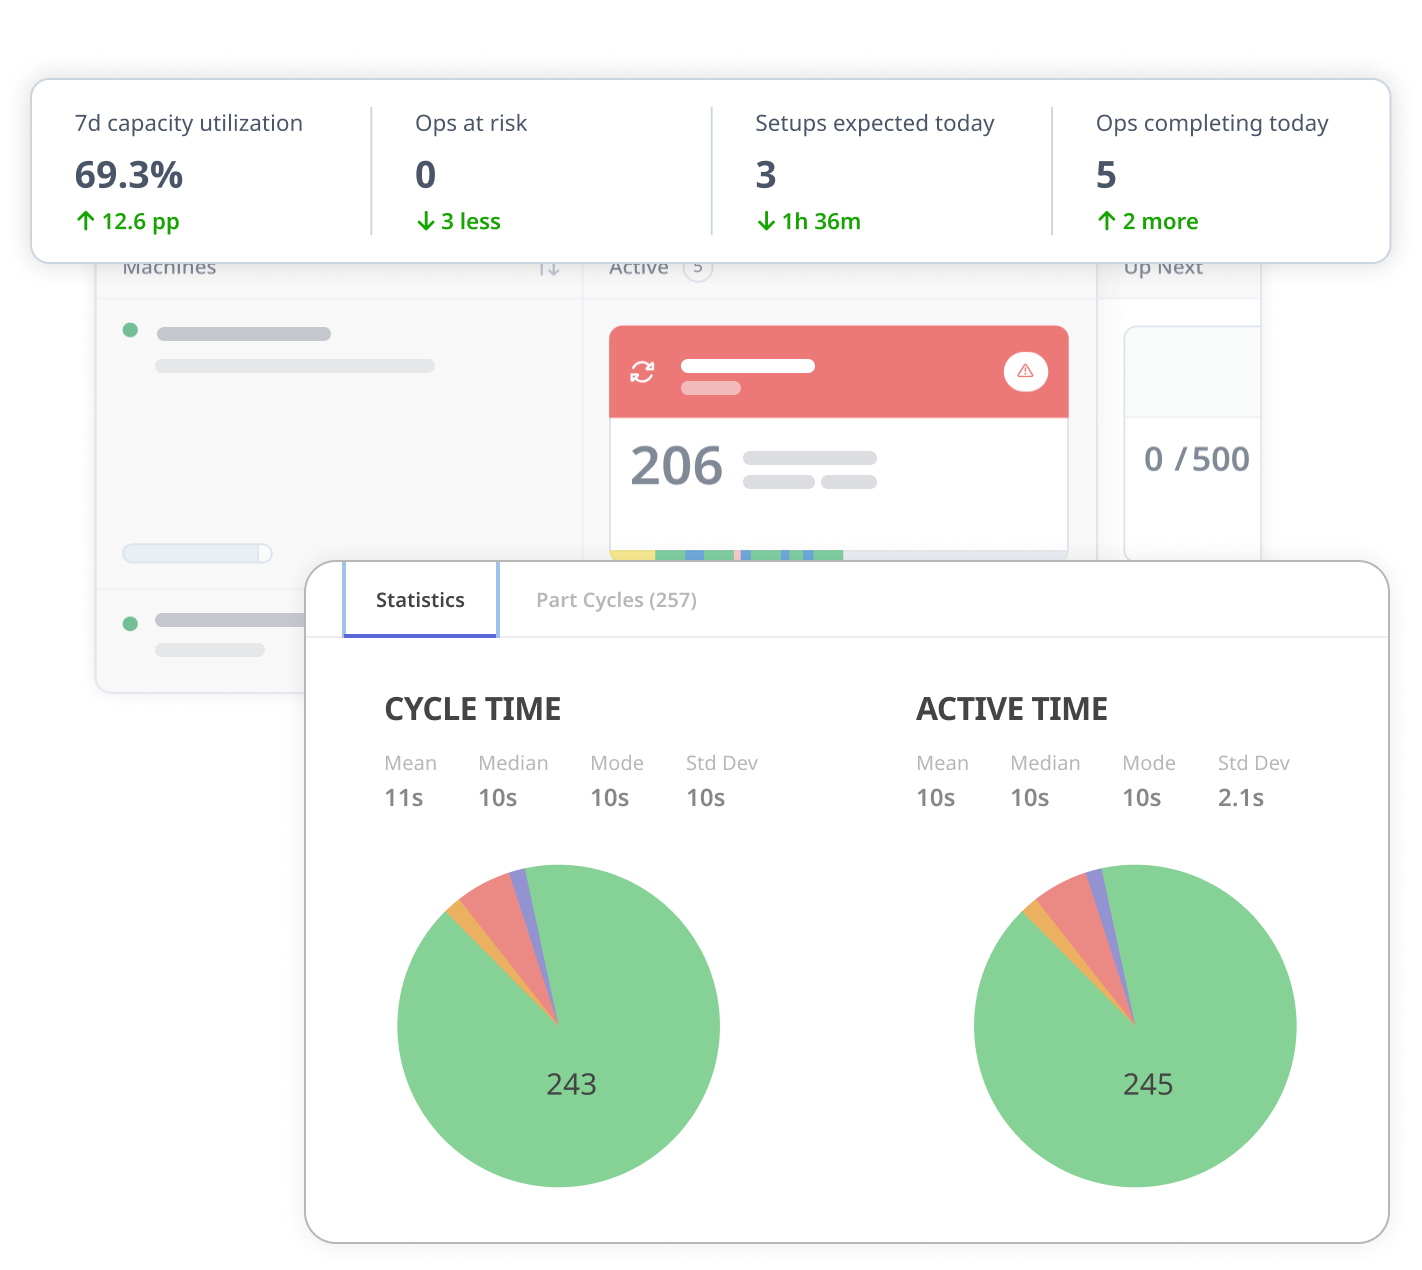
Find out which cycle times have been costing you for years.

Every part and operation you run, measured against the standard your ERP quotes from, with the parts running long ranked by what the variance costs across a year. Set ideal cycle times per part, operator, machine, or shift.
Frame 1000005966

Build the report nobody wanted to build.

Utilization, OEE, downtime, and setup reports come out of the box. Filter by date, machine, group, shift, job, part, or operator, then drill to the event behind the number. Anything that isn't standard, your team builds in the browser: no BI tool, no report writer, no ticket to IT.
Enterprise Dashboard 02

SCHEDULE IT ONCE. GET IT WHEN YOU WANT IT

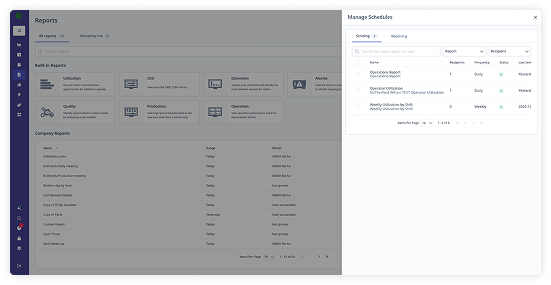
Schedule any report or dashboard for email delivery — daily, weekly, monthly, or specific dates — with PDF attachments and multiple recipients. The morning report lands before the meeting. The shift summary reaches the incoming crew. Leadership gets the monthly without anyone assembling it.
reports-manage-scheduled-reports-modal 1

ASK A QUESTION. KEEP THE ANSWER.

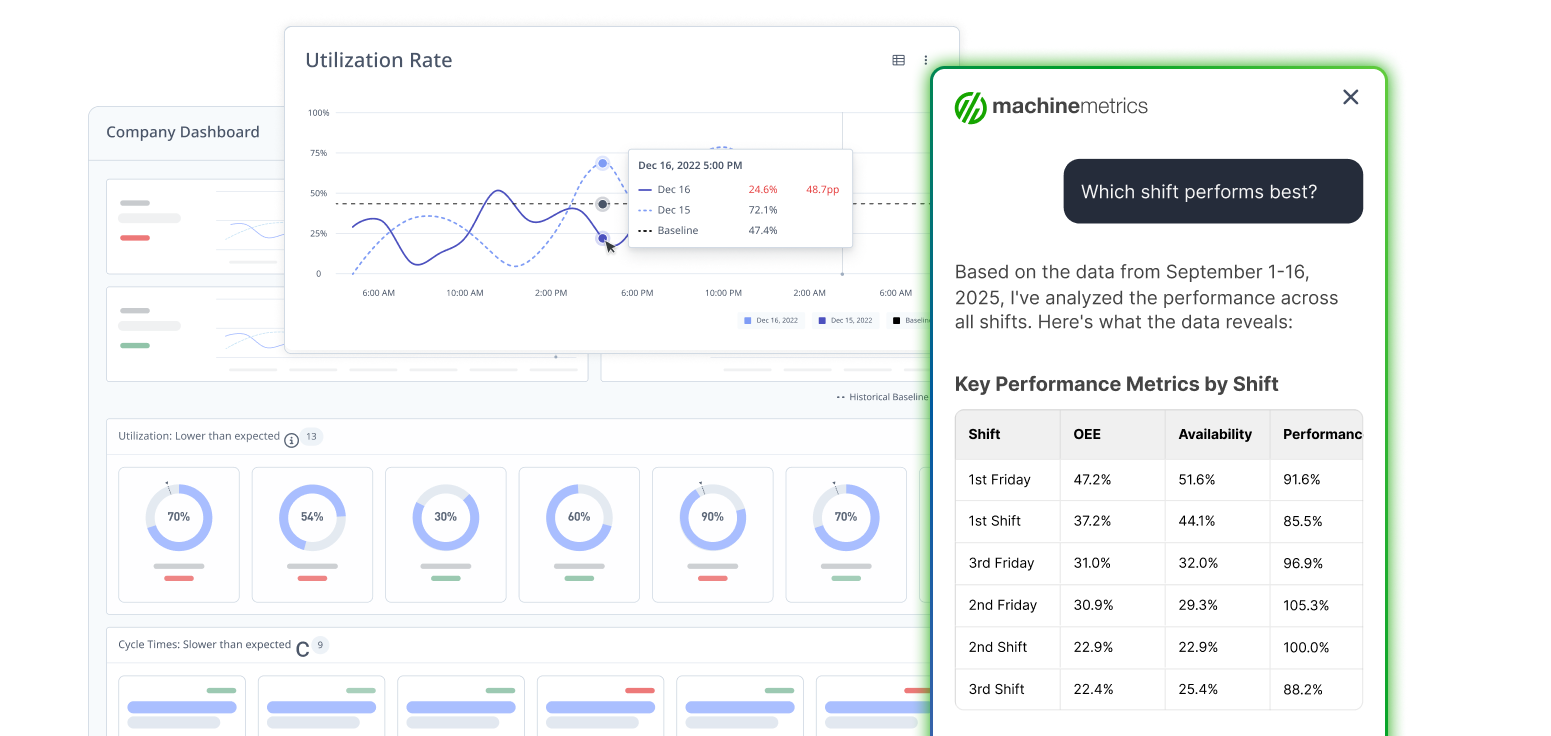
Ask about production, downtime, OEE, or cost in plain language. Max AI queries live data and returns the summary, the breakdown, and the chart, including the cost of lost time by category. Follow up to drill from symptom to driver, then keep the chart as a dashboard, or deliver a report to your inbox when you want it. Validate any answer against the reports it came from.
Frame 1000005978 (1)

Find out at 10 a.m., not at the Monday review.

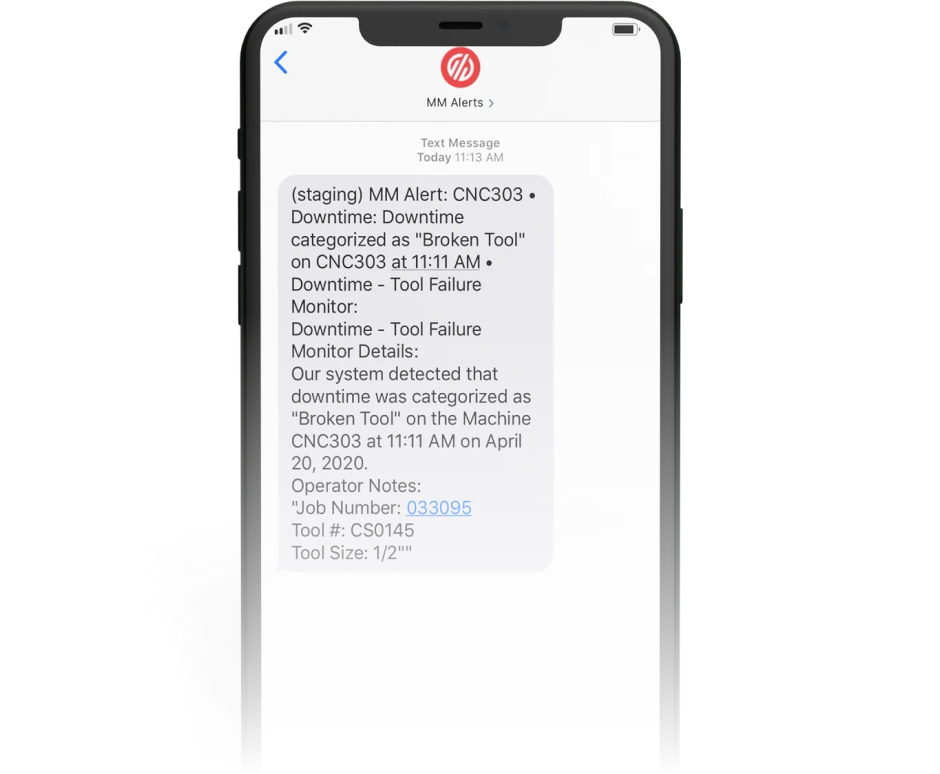
Set thresholds on cycle time drift, missed parts goals, or downtime duration. Route alerts by email, text, or webhook so they land as tasks in the systems your team already uses. Extend the same thresholds to temperatures, feeds, and speeds, tuned per machine. A shift you hear about at ten is a shift you can still recover.
downtime text alert

Comparable plants, without a normalization project.

Aggregate the whole footprint into one metric view, then drill from enterprise to plant to machine. Compare sites side by side on utilization, OEE, availability, and parts goal — calculated identically, so a gap is a real difference and not a counting difference. Segment by machine, cell, or department underneath. Capital follows evidence instead of the most persuasive plant manager.
Enterprise Widgets Utilization Towns 2
See It In Action

Tuffaloy judged performance by the tower lights, until they found machinists could make a light green with the spindle stopped. Now every number comes off the machine, and a part running slower than expected shows up the same day instead of at job closing. GREEN LIGHTS AREN'T A METRIC.

TESTIMONIALS

THE NUMBERS STOPPED BEING THE DEBATE.

When every metric traces back to machine data, production meetings get shorter and improvement projects get funded on evidence.
Explore Case Studies

OFF BY 300%. NOW WITHIN 2%.

"I can't stress enough to have accurate utilization data. And with MachineMetrics, we're plus or minus two percent."

- Dave Roberts, Continuous Improvement Manager

OEE from 57% to 85% and utilization from the mid-20s to 60%, with good parts rising from roughly 4,200 to more than 10,000 within five months and no added equipment.
OEE averaged 25 to 30% and was calculated on paper. Within five weeks, it reached 44%. It has since held above 60% and routinely hits 80% weekly.

Keep Exploring Solutions

Group 427322032
downtime

DOWNTIME TRACKING

The availability is half of the number, captured automatically and priced in dollars.
Learn More
quoting

CAPACITY & QUOTING

What a real utilization number is worth once you promise dates and price work from it.
Learn More
multi site

MULTI-SITE VISIBILITY

The same definitions at every plant, so a comparison between two is a fact rather than an argument.
Learn More
labor tracking

LABOR TRACKING & COSTING

Performance against standard, traced through to cost per part.
Learn More

EXPLORE MORE CONTENT

WHAT IS THE EXECUTION GAP COSTING YOU?

calculator

Manufacturing ROI Calculator | What the Execution Gap Costs You

See what production gaps cost you in overtime, scrap, tooling, and maintenance, and how fast a modern MES pays for itself. Instant results.

Learn more

CASE STUDY

Optimizing Overall Equipment Efficiency and Utilization at Avalign

In this exclusive interview-style case study, Director Matt Townsend discusses the impact of deploying MachineMetrics at Avalign Technologies.

Learn more
blog

How OEE Software Improves Production Efficiency

OEE software gives manufacturers faster, more accurate data on machine performance so they can make the right decisions to drive production efficiency.

Learn more

case study

KRPM Kirby Risk Precision Machining Video Case Study

Dave Roberts, CI Manager, discusses the impact of deploying MachineMetrics at Kirby Risk Precision Machining. The result was trustworthy analytics, improved communication, and a 52% increase in utilization.

Learn more