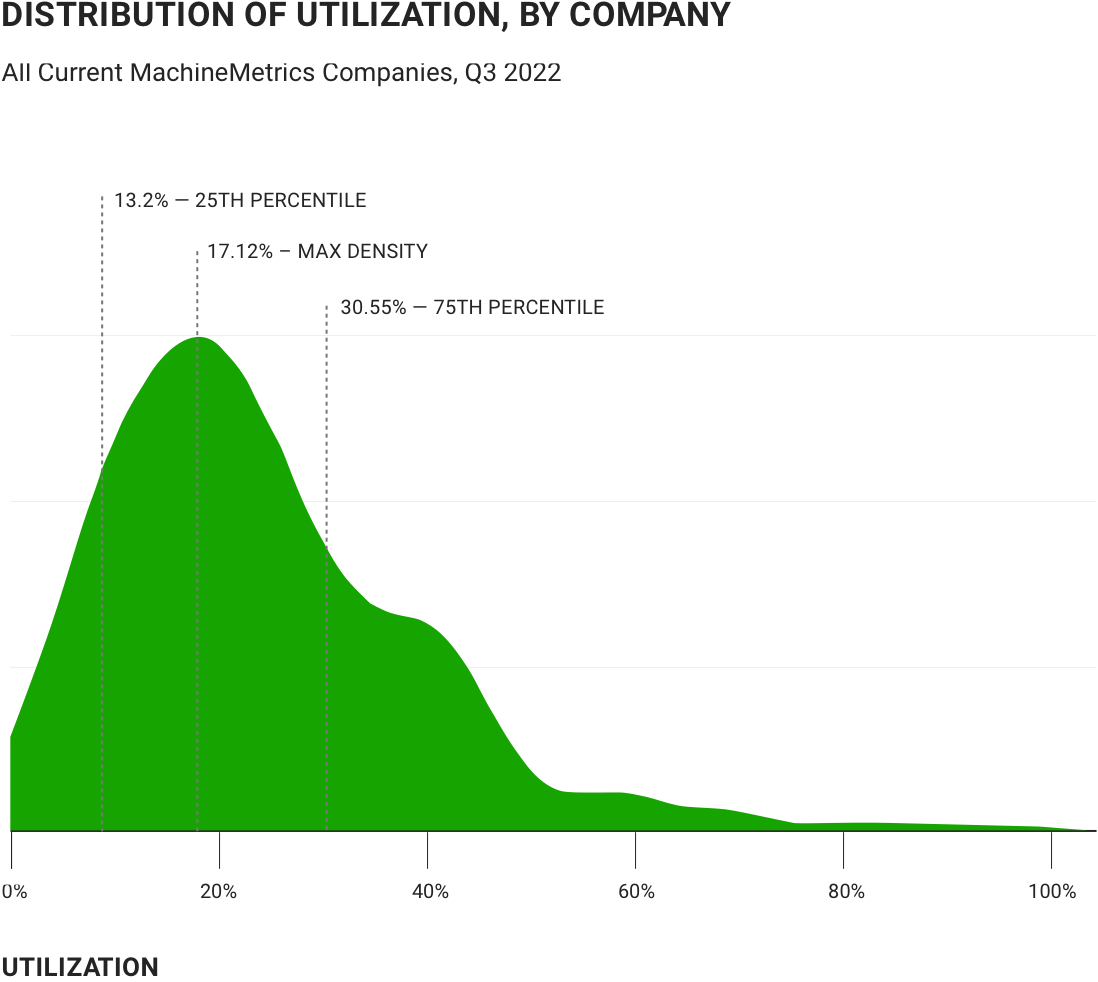
Intro
2022 by the numbers.

Between supply chain constraints, labor shortages, and increasing market competition, manufacturing leaders have had their fair share of challenges to contend with.

How has the industry reacted to these challenges over the past year?

Since 2017, MachineMetrics has collected data directly from the controls and sensors of thousands of machine tools. These machines span hundreds of companies in the United States, representing all kinds of machine tools in all types of industries.

Read on to see how you match up against others in the industry. Or watch our State of the Industry Report.

UTILIZATION
Utilization 2019-2022
THE SURVEY
PROPRIETARY DATA
State of the Industry Report by MachineMetrics
Thousands
of machines sampled
HUNDREDS
of organizations represented in the data
The Challenge
The difficulty of collecting such a dataset cannot be understated.

Data in the manufacturing industry continues to be siloed by individual companies, with each manufacturer keeping their data for themselves. This is understandable, as without a neutral third-party, sharing data can feel risky and unwarranted.

This isn’t to say that third-parties haven’t attempted to collect industry data. Industry associations have conducted national surveys for decades through traditional means. These surveys are all voluntary surveys that require data from the contributor in return for survey results. Companies send their data up to the Association and receive overall industry trends in exchange for their data. While this may seem like the most straightforward way of getting insights into the industry, the approach actually has an array of drawbacks.

np_survey_1051332_393b3e
A note on survey bias
We find that the top three reasons for lack of accuracy in self-reporting surveys are as follows:
circle
Nonresponsive or altered repsonses
Due to embarrassment of low numbers
folder
Imprecision
Due to lack of accurate reporting controls
malic
Malicious Reporting
To sway results and throw off competitors

It takes time for the respondent to compile and send their answers every month, which can burden the company with significant overhead especially if there is no infrastructure set up for reporting.

Economic downturns or slowdowns in business often cause non-reporting, as more imperative business matters trump using resources to report to a survey. This, unfortunately, is when your business needs industry information the most -- in a month where there’s a blip in sales, knowing where you stand and what segments to focus marketing efforts on can be of paramount importance to recovery.

With the State of Discrete Manufacturing report, manufacturers don’t need to worry about reporting or not reporting. The insights will be there regardless, as the data is autonomously collected and anonymized.

Machine Data
Details
Metadata collected Includes:

• Machine type
• Geography (down to city)
• Timestamp down to the millisecond level
• Company information
• Machine shop type

Types of machines include:

• Mills
• Lathes
• Swiss CNCs
• Grinders
• Stamps

MACHINE DATA COLLECTION
MachineMetrics autonomously cleans and standardizes data, without human error
edge-circle
Edge Connectivity
  • Plug-and-play machine connectivity from PLCs, digital I/O, and analog sensors
  • Transformation of machine data to standard data structures
  • High-frequency data analytics at the edge
infrastructure2
IIoT INFRASTRUCTURE
  • Multi-tenant cloud infrastructure optimized for machine data
  • Machine performance and condition reporting via APIs and BI-Integrations
  • Rules-based workflow triggers for any shop floor data item
applications
FEATURES
  • Vertically-focused use cases digitize legacy manufacturing processes
  • Automated notifications to enhance reaction time to problems
  • Real-time and historical data to analyze and improve performance
cluster
Data is algorithmically anonymized, cleaned and compiled before it makes its way into our report.
sml1
What differentiates our report is that there is no human in the loop to corrupt the data collection process.

Through the adoption of the MTConnect standard, we collect normalized data items from all of our machines and aggregate them programmatically. Our data is not obtained through questionnaires, but through automated data pipelines. There is no manual process of phoning participants, entering data into forms, or dealing with survey dropouts.

sml2
A large part of what we’ve been doing over the last half-decade is compiling a library of adapters that can pull data directly off the PLCs (programmable logic controls) of many different types of machines.

These adapters are constantly pumping fresh data into our pipelines every second, and we’ve gotten to the point now where we’ve compiled thousands of machine-years worth of machining data. While our machines span across the globe, this report focuses on the United States and comprise a representative sample of American manufacturing.

Topline Numbers
23.9%
Average Utilization Q4 2022
-6.7%
Percent Change Quarter over Quarter
25.9%
Average Utilization 2022
combined-shape
Key Takeaway

Machines generally had a monthly average utilization between 22% and 30% throughout the year, with a trend downward that originally began in March 2022.

Machine-Level Insights
Machine Type Utilization by Time (Month to Month)
Over the course of this year, we see trends for each machine type, with Grinders being especially high performers. Utilizations for most machine types vary approximately in tandem with each other, showing stronger performance earlier in the year. This potentially reflects larger economic trends.
2022 Utilization Trend Over Time, By Machine Type
utotbmt
Factory Level Insights
Let’s dig into the factory level numbers, which aggregate all types of machines together.
  • Density Plot

    We can compute utilization for each of the companies that we work with by averaging over all of the machines in their individual shops. What happens when we look at the distribution of these company-level utilizations among our customers? Unsurprisingly, the curve is quite similar to the density plots over machines. Though average utilization stands at about 26%, most companies appear to perform around 17-20% utilization, with a fat tail of high-performers stretching into the 60’s. A manager can get an immediate sense of how competitive they are by just learning where they live on this plot.

    ubh
  • Utilization by hour

    When we look at average utilization over the course of a day, certain “key hours” are revealed. Factories seem to have “high utilization” hours from 8 am to 3 pm, with a slow and steady ramp-down period from there until the following day. If we look at the line plot to the right we can see that 4 AM is the slowest period, with 10 AM being the time at which most machine shops are firing on all cylinders.

    hour-of-day-new2
  • Utilization by day of week

    Aggregating utilization on day of week, we confirm some biases that may have been common sense to factory owners, but putting numbers behind it has been hard until now. It’s known that weekends tend to have lower utilization, but an interesting find is that Mondays and Fridays are also significantly lower than middle of the week utilization.

    daily-util
ECONOMIST LEVEL INSIGHTS
OVERALL TRENDS

Aggregating over all machines for all of our companies, industry-wide trends are revealed. One of the most basic questions that we can ask is: “On what days of the year are machines actually up and running?”

  • DAY OF WEEK UTILIZATION OVER TIME

    When we break down our aggregated trend over the past calendar year by day of week, we can of course immediately infer that weekdays are more productive than weekends. But we also see that utilization becomes less stable as we move away from mid-week. There also exists some correlation between weekend and weekday utilization.

    utbdow
  • Correlation to economic indicators

    We’ve been tracking our utilization data to several economic indicators, and have found it to be highly correlated to several key economic series including: Industrial Production for Miscellaneous Metal Goods (the Fed’s proxy for Medical Device Manufacturing) and Value of Manufacturers’ Shipments for Motor Vehicle Components. This makes sense to us, as automotive and medical are two of the biggest industries discrete manufacturers serve. When MachineMetrics’ customers manufacture more of the component parts of cars and medical devices, their utilization goes up. The output of machined goods serves as a very tight correlate to the production of the products they ultimately go into: motor vehicles, trucks, metal implants, etc.

    mu-vs-ma
“The data will always be honest”
BENCHMARKING IN ACTION

Using this data, customers have the ability to make decisions on if they need new equipment, or if existing capacity already exists. One customer mentioned to us that if they had these reports, they would go straight to the bank for funding for new machines, citing third-party evidence that they were best-of-class and already above the industry norm in terms of utilization. He would also bring it to customers and potential customers to demonstrate that his shop is one of the top shops, and that they had data to prove it.

Conclusion
DATA TELLS A STORY

We release a MachineMetrics index of manufacturing, which is calculated by indexing the utilization of January 2018 to 100. Through this index, we can get a good idea of how manufacturing is progressing over time.

MachineMetrics customers can benchmark themselves against these reports to understand where they stand in relation to the industry.

Want to see how we capture this data from machines and enable manufacturers to make data-driven decisions?

Watch a video demo of MachineMetrics. Or set up some time with our team.

iom