Process improvement techniques are essential for optimizing manufacturing tasks. And when done right, these optimized processes lead to greater efficiency. But what is the connection? And why is process optimization so crucial for achieving greater efficiency?
The answer to this lies in the effectiveness of an activity. It's not enough to have many things being produced. The tasks, checks, adjustments, and motion required for producing finished goods must be orchestrated to find the with the least amount of input.
Many companies describe this as “a path to continuous improvement”. And in the case of most manufacturing operations, that path centers around the machine. People, such as operators, mechanics, and technicians, interact with their machines out of habit and training. Most of their efforts are aimed at ensuring the maximum amount of uptime. But whether data is manual or electronic, the effectiveness of their actions is what counts. And the act of making adjustments that make that interaction more effective is called process optimization.
What is Production Optimization?
Production optimization is a collection of activities designed to increase productivity in the production system. It’s separate from process optimization, where the optimization effort is focused on making the finished product more efficient in its stages.
Production optimization uses models, analysis, prioritization, and measurements to increase productivity. This optimization includes equipment, staging areas, inventory protocols, facility layout, conveyance, and more.
Optimizing production is a tactic used in large footprint industries such as oil production and gas construction. But optimization can be used in most manufacturing operations for almost any production process to deliver greater value.
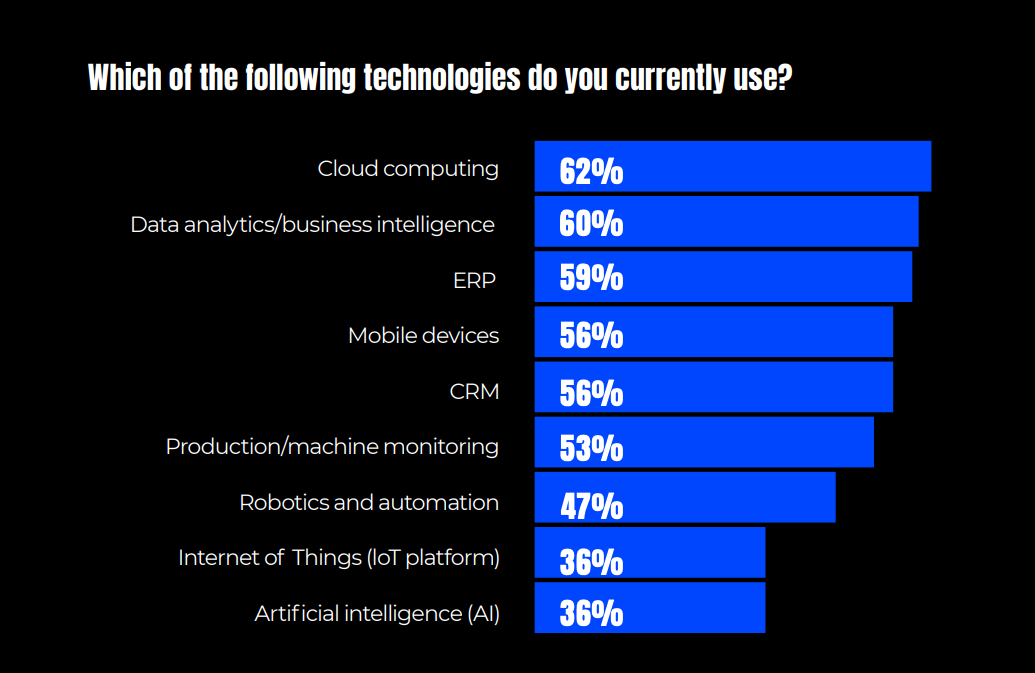
As IoT technology has matured, companies have discovered that information delivered from real-time data analysis allows them to understand the changing conditions and flow of the system and how it can be used to enhance productivity. Companies must use these insights to optimize production rates in the entire production process.
Examples of areas where insights can lead to production optimization and greater value include:
- Work in Process: Many companies focused on "process improvement" technology center their efforts entirely on the product itself. But work in process can impact productivity significantly. Too much inventory tied up for too long hurts cash flow and can create potential taxation issues. Due to multiple moves, it may also increase labor cost to move products from station to station unnecessarily.
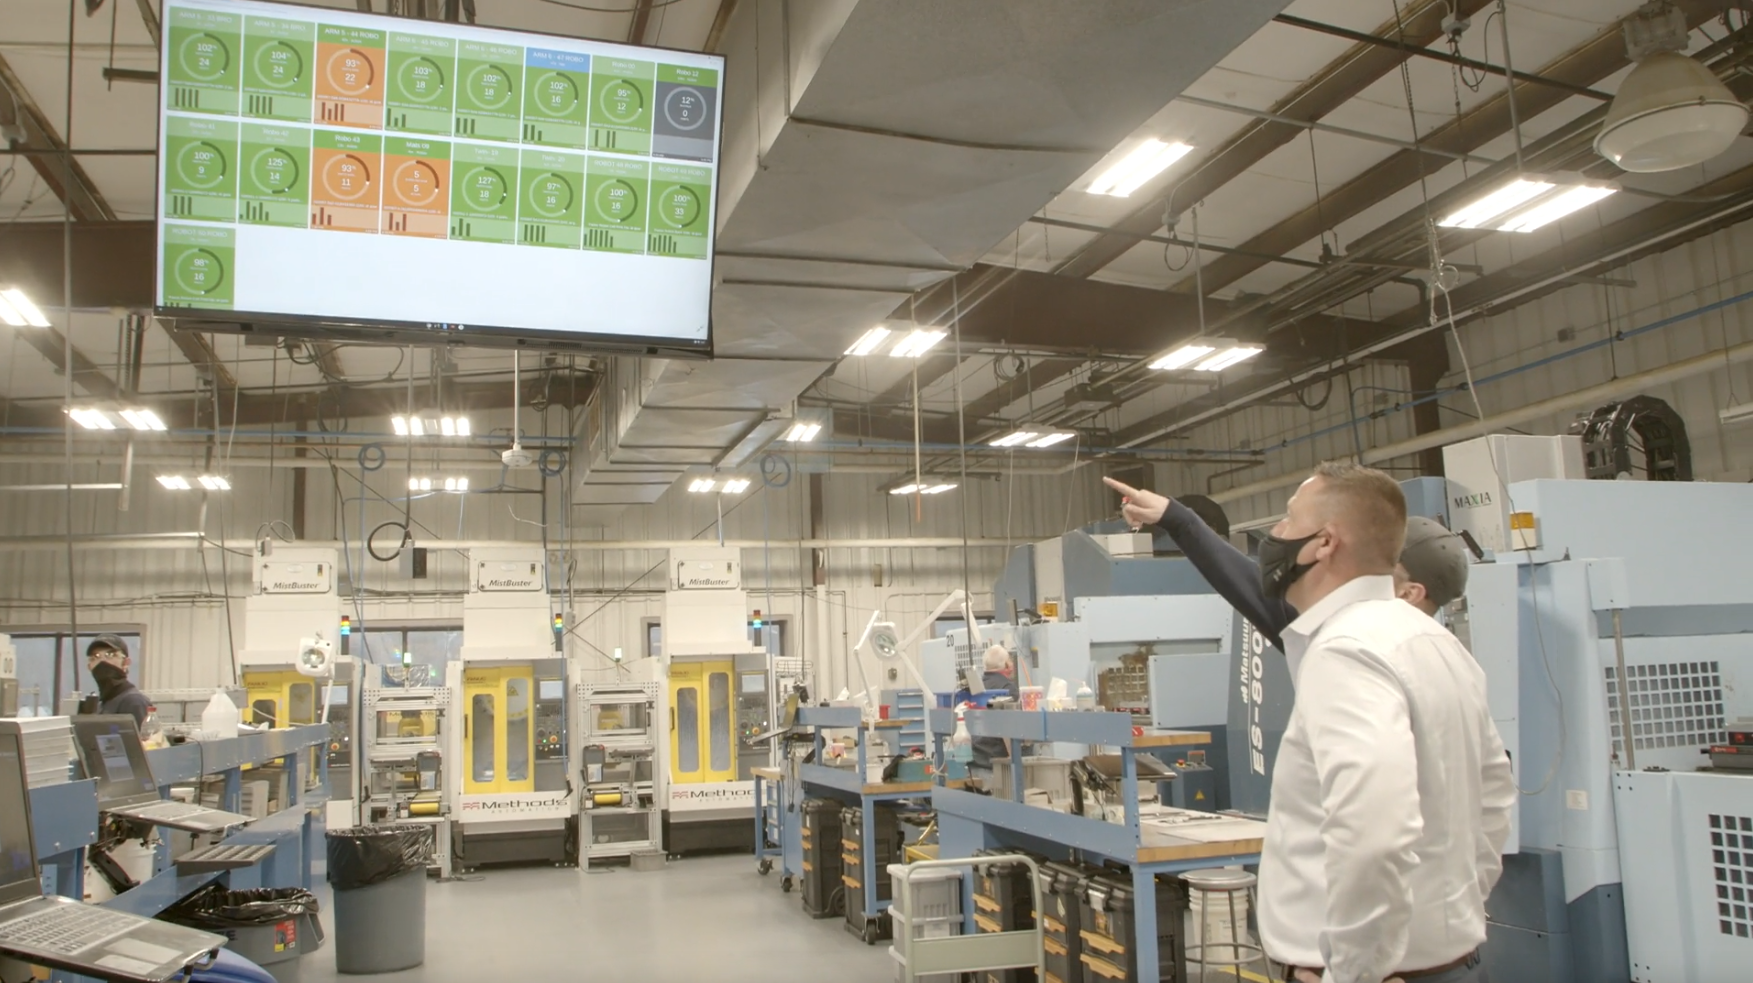
- Workstation Auditing: As technology has made interactive manufacturing dashboards and factory boards digital, the placement of these HMIs may need to be reconsidered. What made sense in a manual tracking environment may increase workloads or reduce effectiveness in a digital environment. HMIs, screens, monitors, and other devices are low profile and can be placed in a way that enhances productivity.
- Unnecessary Space: In manufacturing, dead space will often wind up as the home for WIP with no place to go. This means more handling and increasing operating costs.
- Bottlenecks: Bottlenecks can trigger work stoppage in upstream production processes. If factory monitoring platforms have begun maximizing the output of some workstations, managers may need to address a bottleneck that results from this upstream increase.
- Improved Inventory Communication: As real-time data highlights problems and prescribes solutions, technology will enable new protocols for warehousing and inventory to lead to increased production. Communication is key to the flow of materials in the new environment.
The journey to digitization and data-driven production includes the requirements to make changes to optimize production performance and lower costs. To take advantage of the technology available, some companies may realize the need to move machines or change the factory's entire layout as the power of an IoT-driven production monitoring platform begins to deliver value.
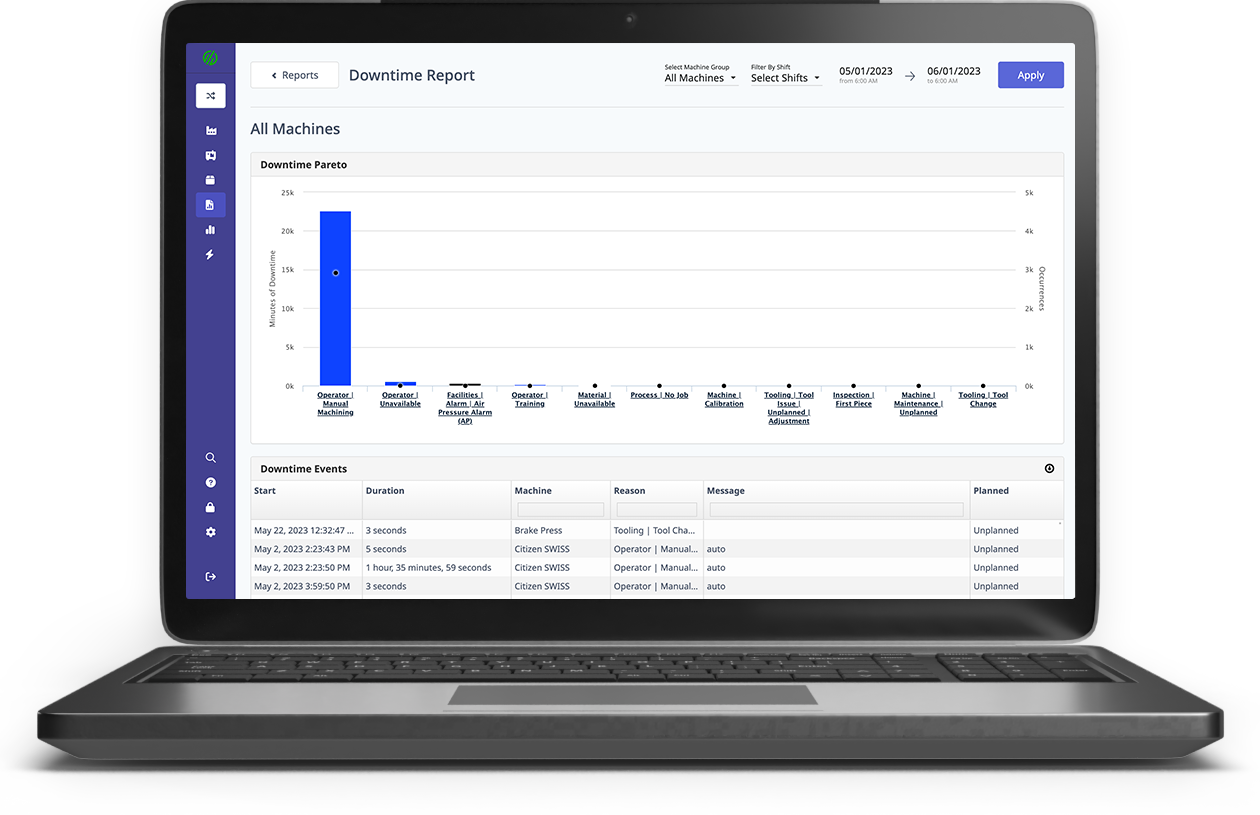
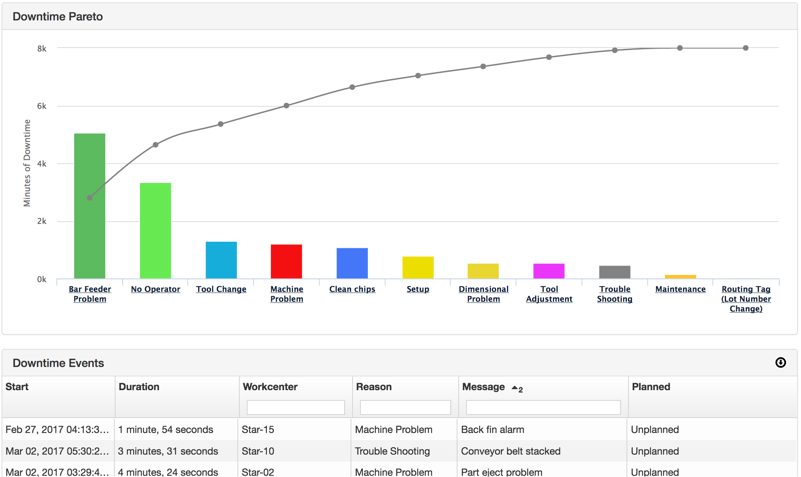 The top downtime reasons are analyzed in the MachineMetrics Downtime pareto chart.
The Difference Between Process and Production Optimization
The most significant difference between process and production optimization is that process optimization eliminates unnecessary steps in a specific process step within the production system. It’s a product optimization designed to maximize production optimization through increased efficiency for that step or sub-process. On the other hand, production optimization seeks to optimize the system itself. It may use models based on real-time data to look at flow rates, machine layout, labor utilization, and other factors to improve the physical performance and layout of the entire production system.
Process optimization will include steps such as:
- Identifying problems specific to the process
- Analyzing the current state to create the desired state
- Auditing the change to see results
- Monitoring the change to keep it on track
Production optimization will include steps such as:
- Changing factory layout
- Changing or rearranging machines and tools at point of use
- Implementing new WIP procedures
- Training operators and technicians on how to respond to automated alarms and insights on the monitoring system to eliminate old habits
- Developing new internal inventory delivery procedures
- Assessing monitor and HMI layout
Goals and Benefits of Production and Process Optimization
Production and Process optimization consist of making improvements across several critical areas. Each of these areas cumulatively adds up to more efficient processes and more significant outputs with the least resources expended. By engaging in process optimization, manufacturers can achieve:
Improved Machine Uptime
Downtime is the bane of every manufacturing manager's existence. And many spend much of their time managing its causes, as well as dealing with its consequences By taking a data-based approach, a company can reduce downtime and increase the overall uptime of their equipment.
One way to accomplish this is by analyzing and ranking the top reasons for unplanned downtime in the production process. This information can then be used to adapt or adjust processes to reduce or eliminate many downtime events. Because the list is in rank order of worst to least, the most egregious culprits can be tackled first.
Once uptime has increased and stabilized, managers can methodically proceed down the list, changing process parameters as needed to bring each item in line with requirements. However, the key to this list and ranking is clean, clear data that helps prioritize what needs attention first.
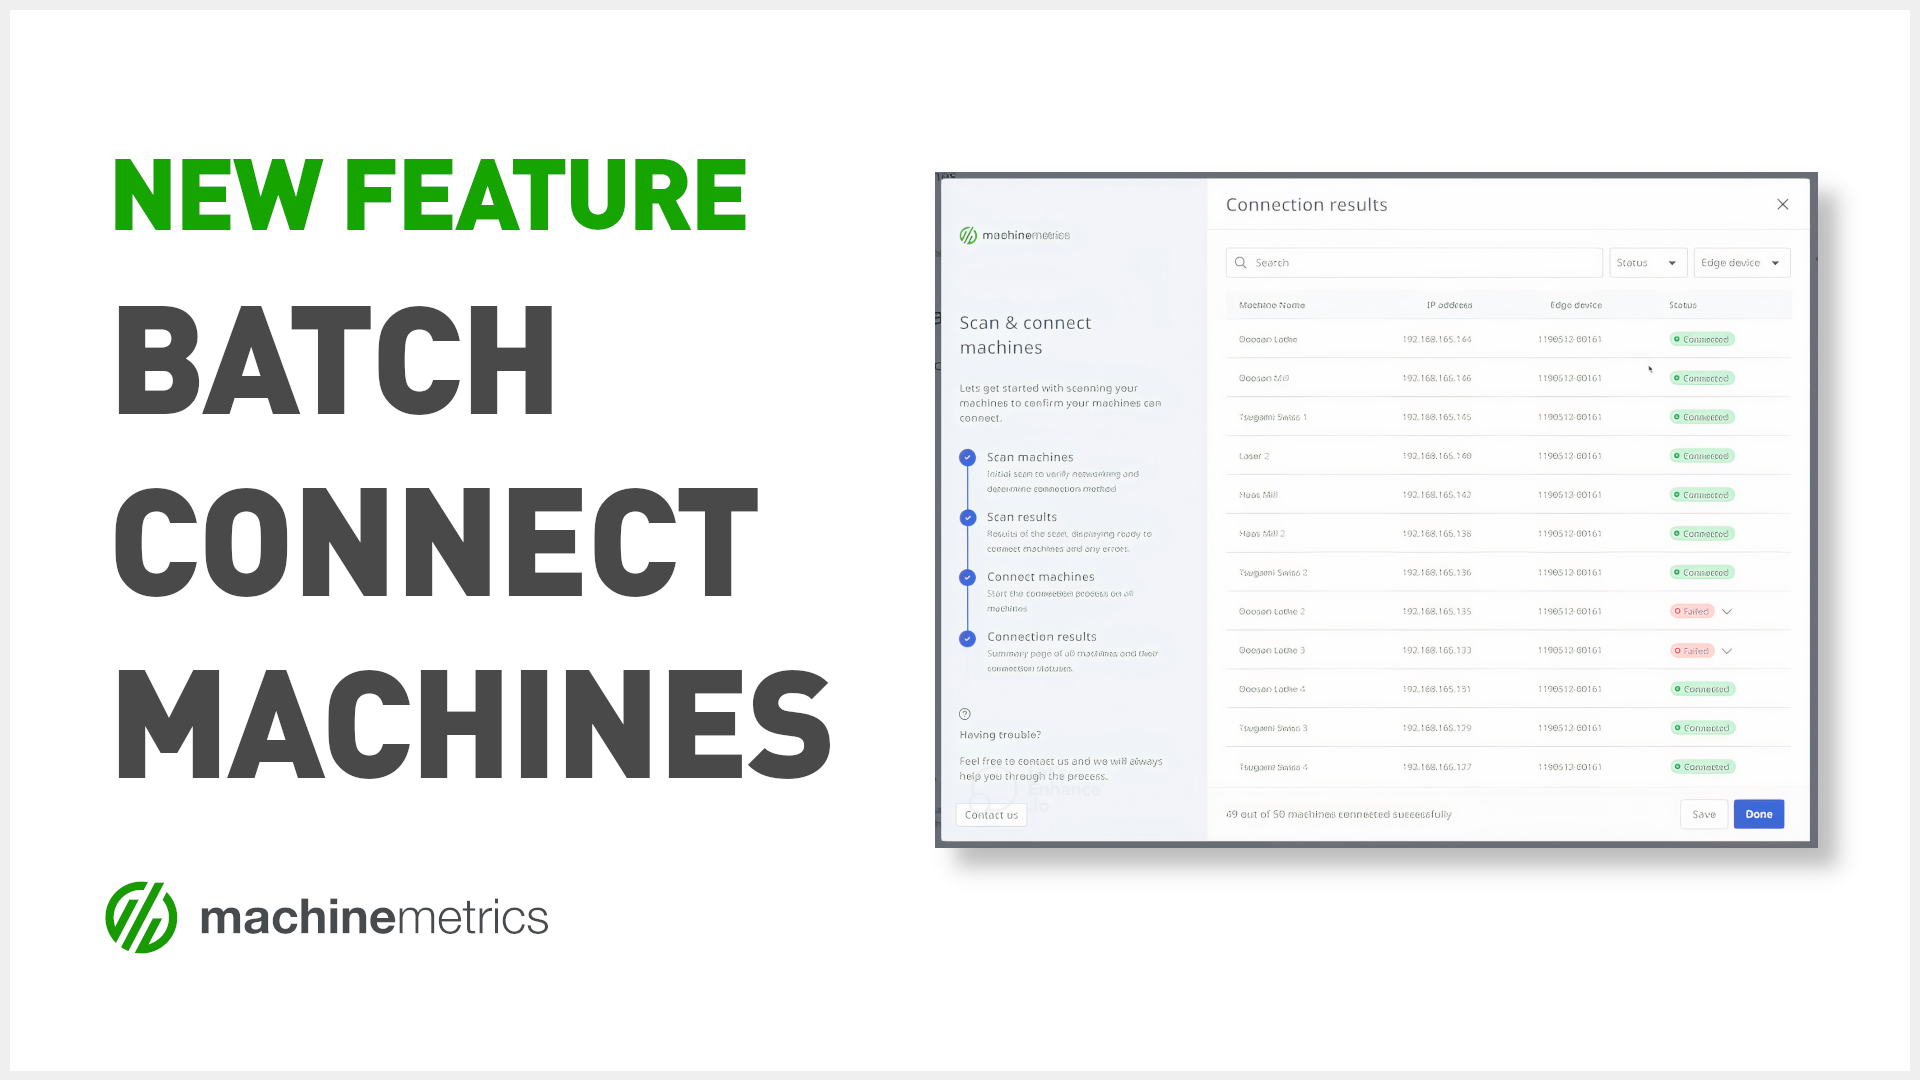
Plug-and-play Machine Connectivity
Faster Response to Issues at the Machine Level
Sometimes, the problem isn't the machine; it's the upstream process feeding the machine. By capturing data to visualize this, changes in WIP flow or other feedstock can be implemented to improve uptime. Another example is training, or lack thereof, with operators potentially in the wrong position at the wrong time to clear alarms and reset the machine as needed.
Again, data becomes critical in helping leaders develop better training to ensure operators are never out of position. The point is that optimizing processes improves response time at the machine level when problems occur. Using data to identify these areas, several areas can be optimized at once for a multiplier effect on uptime. Training, workflow, equipment layout, material quality, and many more issues can be optimized with clearly visualized data.
Further reading: How to Respond to Downtimes Faster with MachineMetrics
Improved Maintenance
Traditional maintenance programs rely upon reactive measures. Either the equipment was allowed to run to failure, or preventative maintenance was used to keep the machine running well.
But preventative maintenance is built on time-based assumptions. It assumes that belts and pulleys will break at a specific time based on broad averages assigned by the original equipment manufacturer (OEM). But this doesn't account for industrial equipment where the product produced is light-duty, allowing for longer lifespans for parts. And it doesn't account for heavy-duty production such as construction, oil production, or oil and gas in general and other surface facilities where parts may wear out faster than planned. In the case of the former, money is spent when it could be deferred. In the latter case such as oil and gas, downtime may occur when it’s least expected.
Advanced technology such as automated data collection can improve the maintenance function and increase the uptime of equipment. By enabling condition-based monitoring, maintenance can be either prescriptive or predictive based on actual conditions. By deploying advanced sensing systems, data can help a company understand the current real-time state of equipment. Over time, deep analytics can help develop new opportunities, predict failures accurately, and schedule replacements at a time when it makes the most sense, such as changeovers or shutdown periods.
Further reading: The Different Types of Maintenance in Manufacturing
The goals for process optimization should include several areas:
- The first is to improve the initial process. Using data, trends and patterns can be identified to help tweak or better dial in the existing process. It may involve an issue of layout, material flow, or communication.
- Secondly, parameters and operating conditions should be addressed. Again, data makes this easier to spot and easier to tackle in order of severity. This may mean machine settings, optimum speed, etc.
- The third consideration is that equipment should be audited to determine the best maintenance approach to improve the equipment's process and uptime. Parts can be staged and prepared beforehand to increase runtime further.
- Finally, accurate data and visualization of machine conditions can help managers develop practical, ergonomic work instructions and better training for operators, technicians, and mechanics.
Production and Process Optimization Methods and Techniques
For manufacturers looking to improve their process efficiency, there are many solutions available:
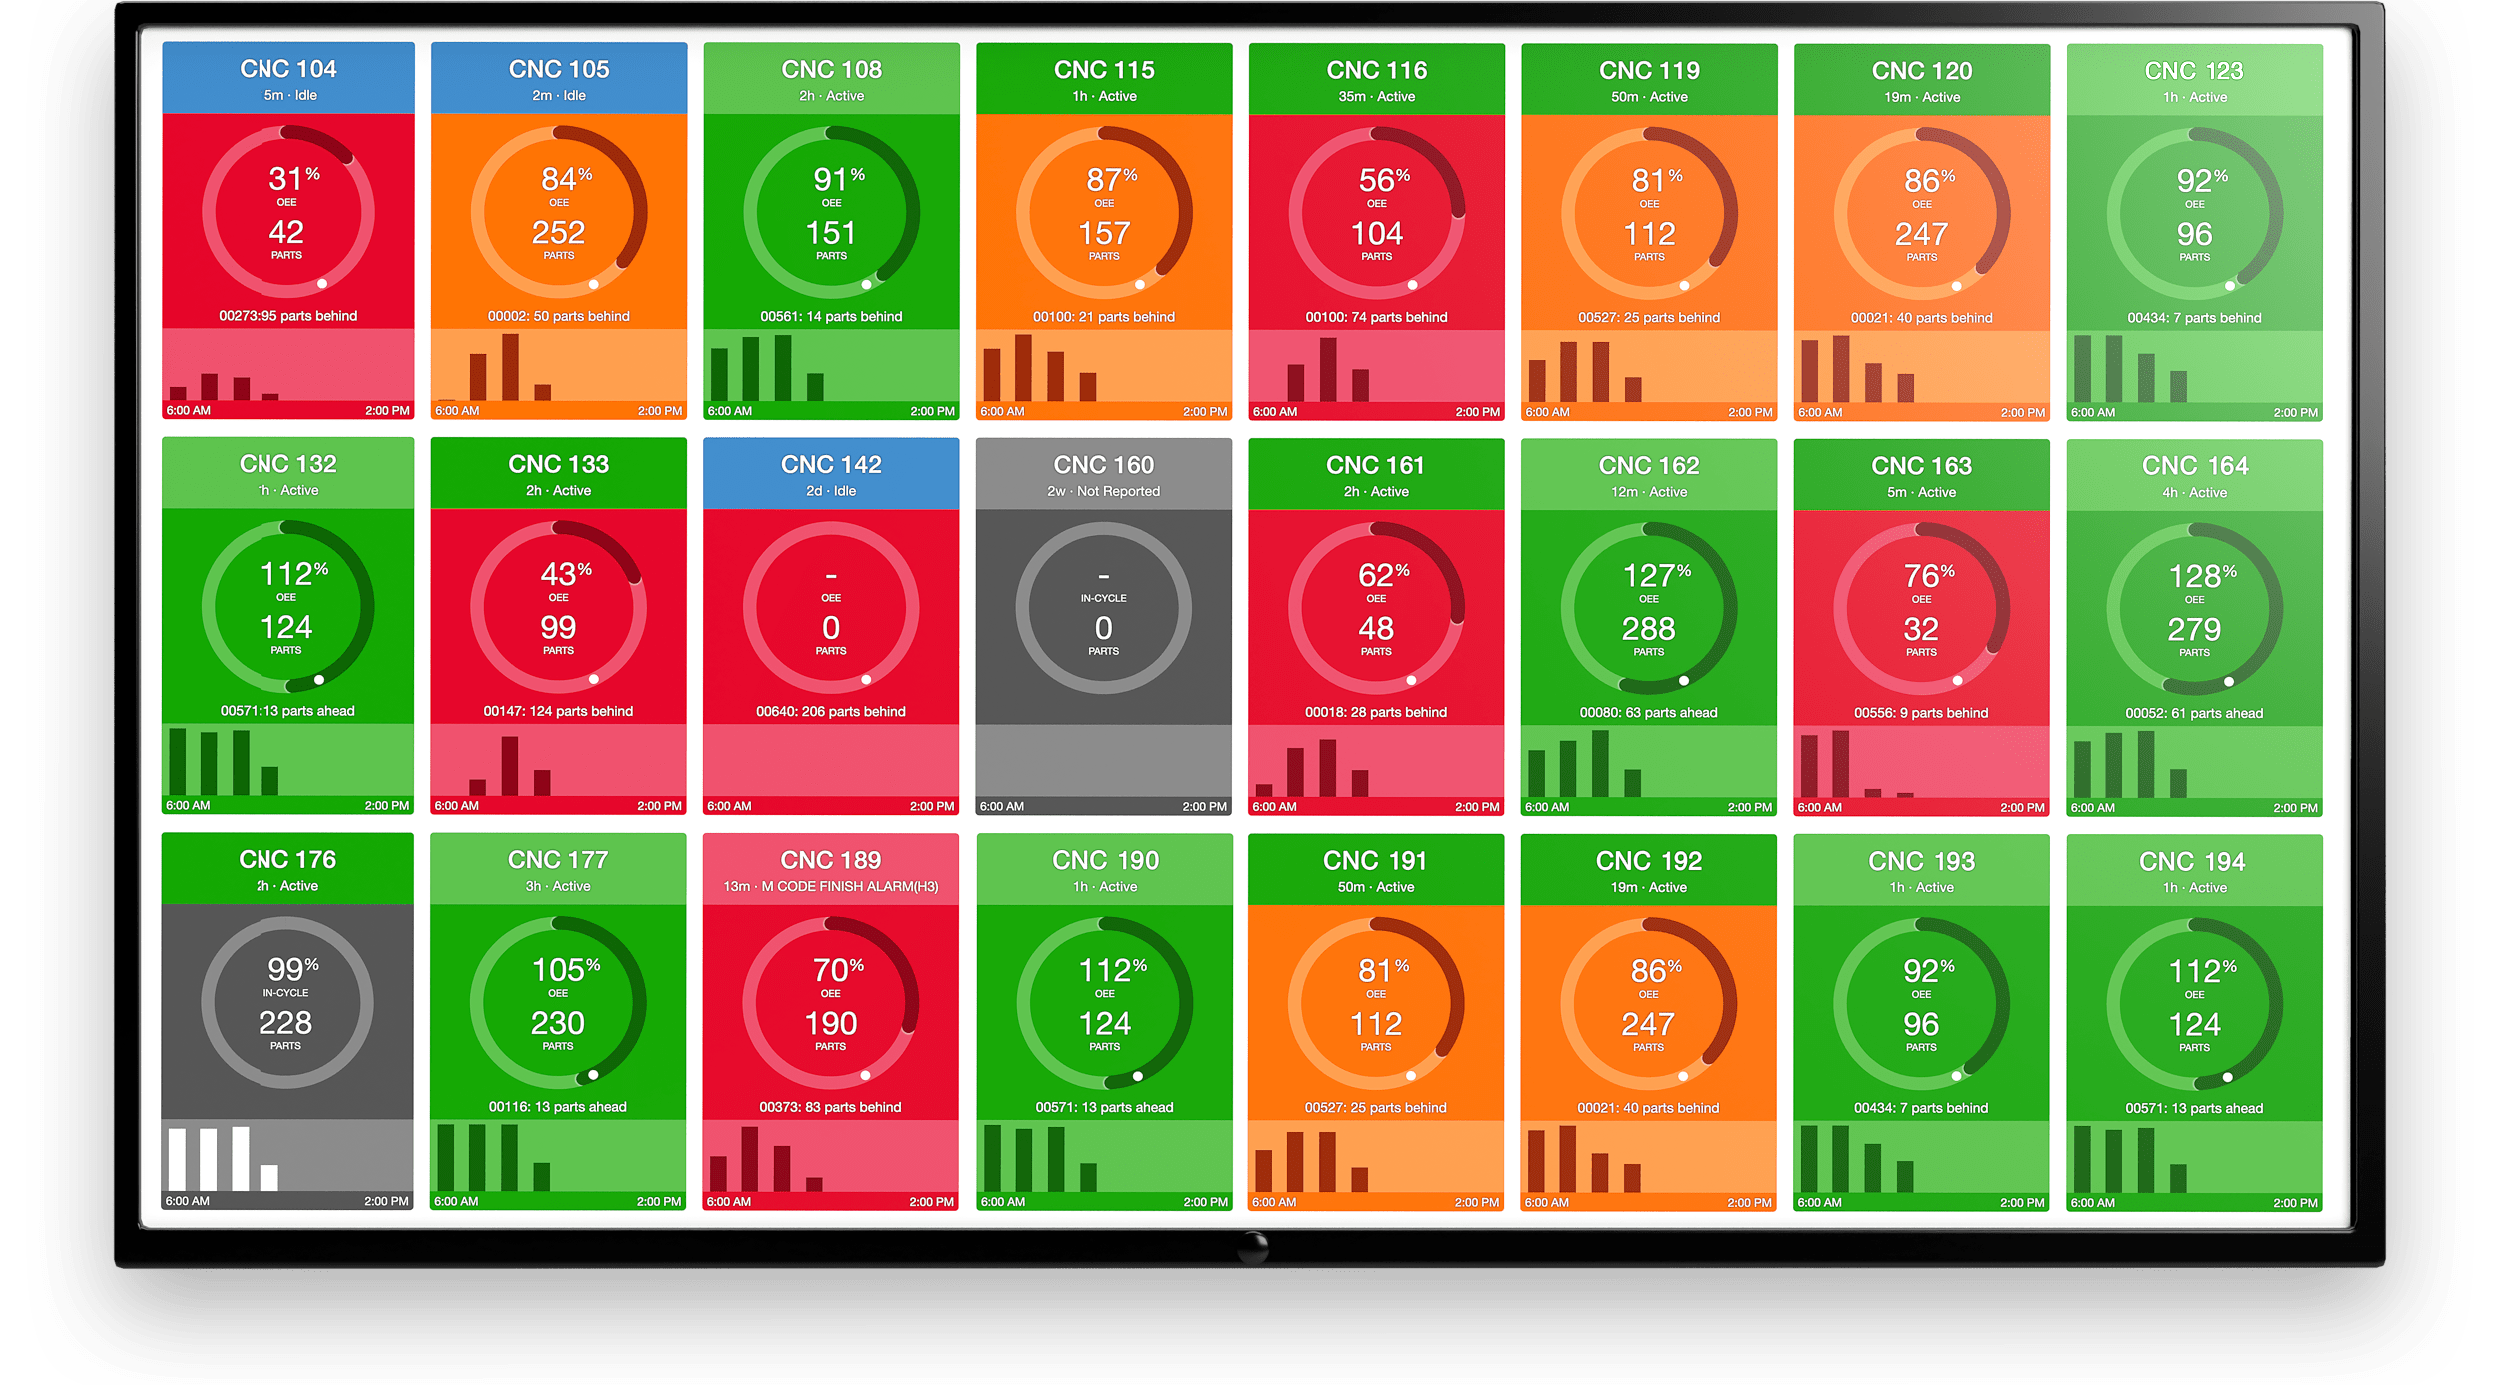
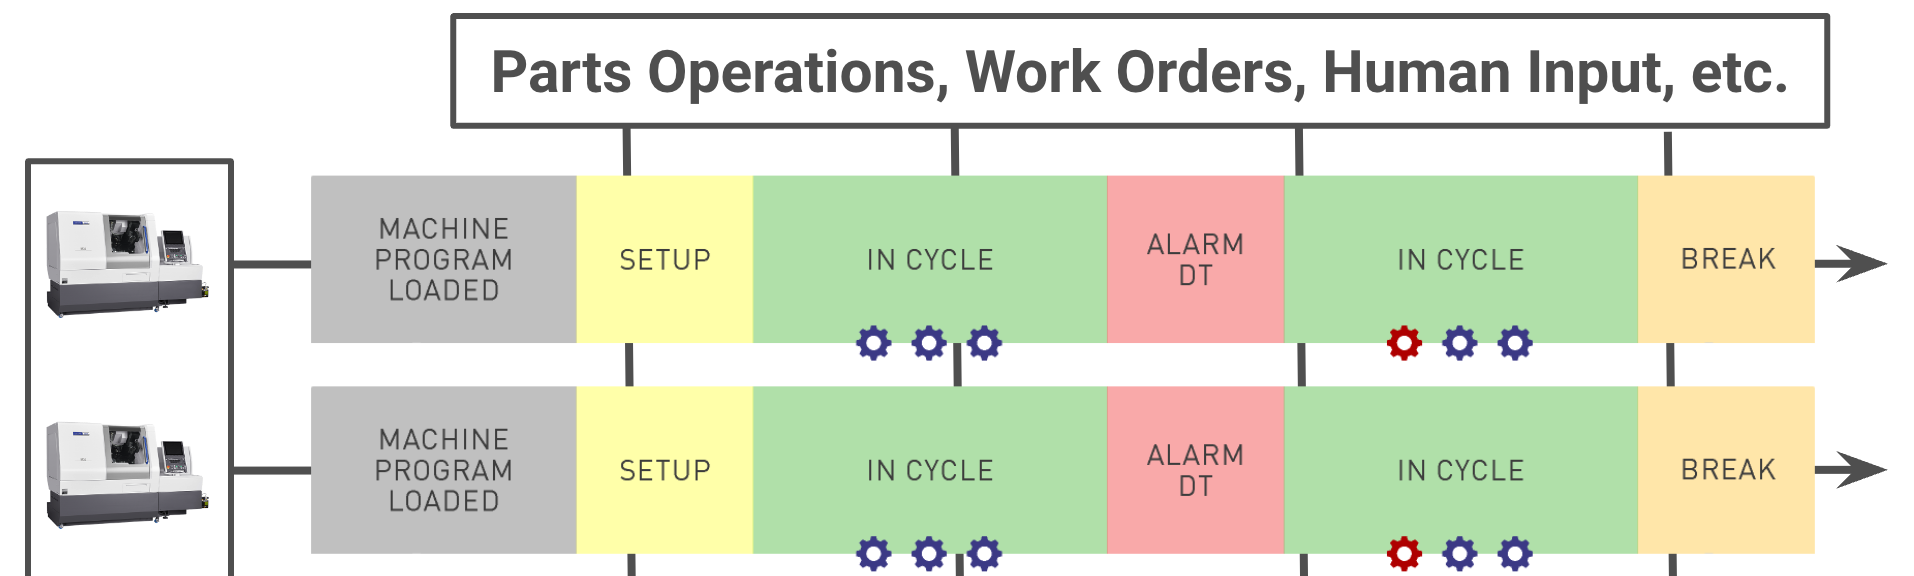
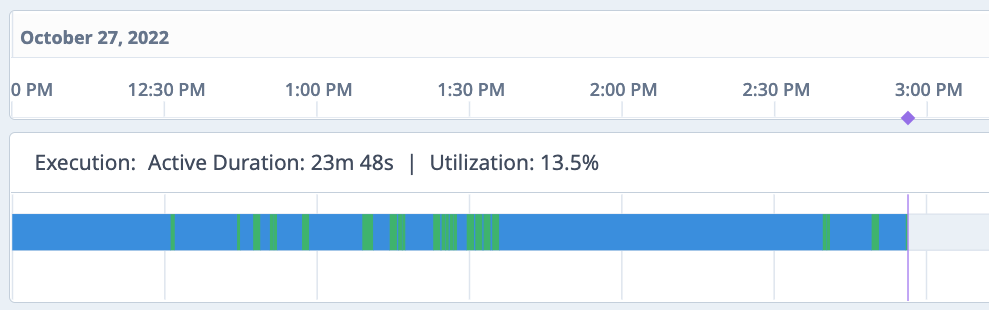
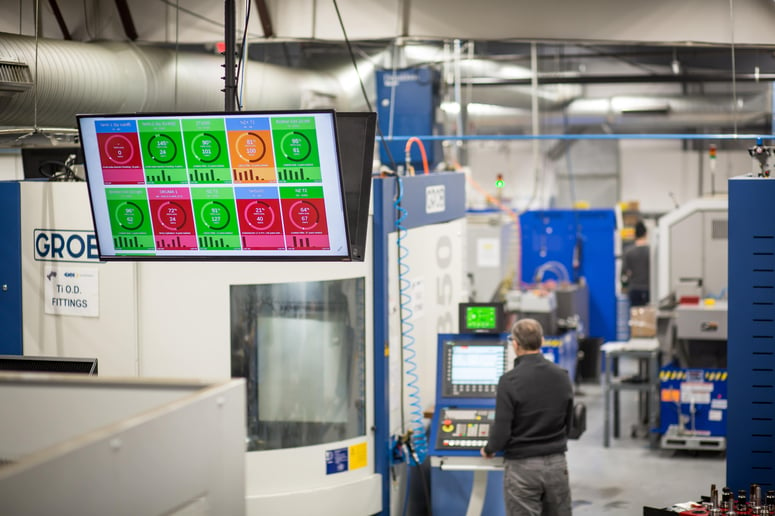 MachineMetrics dashboards display real-time production data that has been automatically collected from manufacturing equipment across the shop floor.
Collecting Real-Time Machine Data
Traditional tracking for process optimization usually meant manual paper-driven sheets and data entry into Excel. This was time-consuming, error-prone, and hard to maintain. Plus, analysis was typically based on human insight, which could be biased or wrong. This is why companies are starting to go paperless.
Collecting real-time data and contextualizing it for visibility by managers and operators allows insights for optimizing production not possible in the past; insights that can allow a proper understanding of production progress and equipment performance on the shop floor. With dashboards and relevant production analyses and reports, SOPs can be changed faster and result in higher quality efficiency and increased production.
Further reading: Manufacturing Data Collection: The Key to Optimizing the Shop Floor
Every manager knows what a bottleneck is and its danger to production processes. And most can identify a few critical areas in their operation where these blockages occur. But just as real-time data provides insights and solutions to optimize the process at a machine level, so too can it lend insight into bottlenecks that may or may not be obvious. Human operators may assign a backup to one cause when data may have determined that it’s another.
With real-time data and analytics, machine and process data can identify bottlenecks and constraints within the entire ecosystem. This data allows operators to track processes to focus on those bottlenecks that cause the most downtime. Whether the blockage is a physical constraint or an operational constraint such as scheduling or missed opportunities to improve setup time and reduce changeovers, cloud-based data empowered with analytics and OEE software can free up the disruption.
Downtime Analysis
A machine downtime analysis is a useful approach for highlighting the areas that need to be addressed immediately. By utilizing captured downtime data by reason, managers and operators can start with the worst offender. But the key to this analysis is the ability to access and query the data, thus understanding the cause.
The use of Pareto charts, percentage of unplanned downtime, high and low performing shifts, and operators, Mean Time Between Failure, Mean Time to Repair, and other KPIs can be gleaned from the data. Through these dashboards, more developed tools and solutions are developed to build a common approach to reduce or eliminate the cause and optimize the process in the long run.
Predictive Analytics
Perhaps one of the most valuable tools when using data-driven software, predictive analytics can supercharge your processes. This software uses machine data to diagnose and predict failure. And because it can connect all equipment within a shop floor, predictions on the entire ecosystem can be made, and solutions deployed more quickly, if not immediately for problem areas that interest the company. It can also do the same for large footprint industries such as oil production and gas production.
Machine algorithms detect patterns that humans simply cannot. This allows proactive intervention before problems occur or well-planned maintenance and changeover solutions when they do occur. These predictive analytics can even be used to extend tool life by monitoring tool wear and predicting when a tool will fail. Custom applications may even allow automated and semi-autonomous solutions to be made at the machine level to free up operators for other tasks to further improve quality and maximize production.
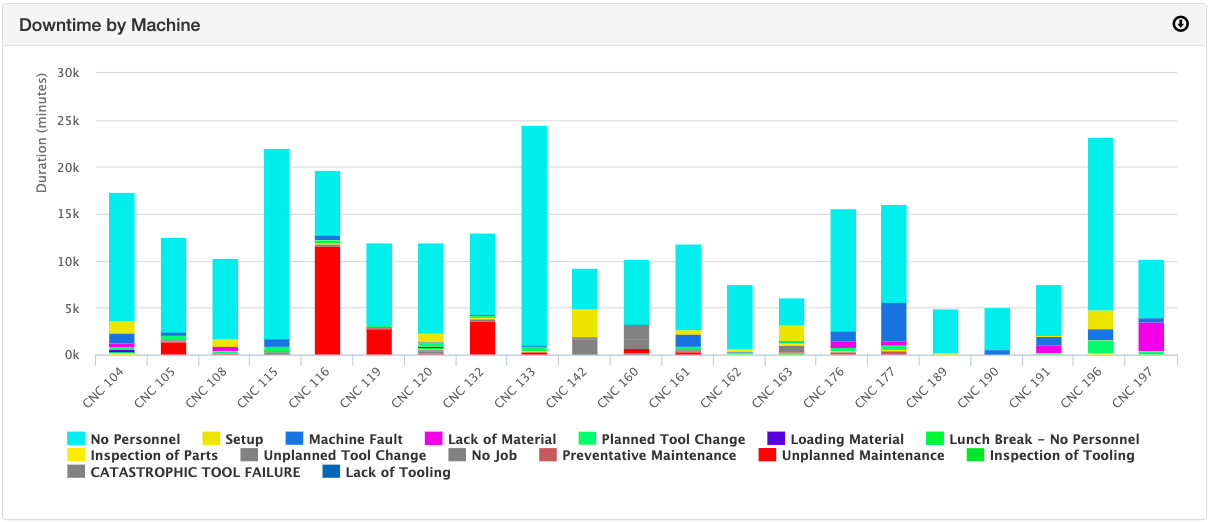
Analyzing downtime reasons at the machine level provides a granular level insight into why specific equipment may be causing problems. Pictured is a "Downtime by Machine" report from MachineMetrics..
Optimizing Your Shop's Processes with MachineMetrics
Using the MachineMetrics Industrial Data Platform, manufacturers can optimize their processes like never before. This optimization is achieved in a variety of ways:
Tracking Machine Downtime Accurately and in Real-Time
Manual tracking of data is inherently flawed. While well-intended, paper tracking can be error-prone and can increase risk. It’s also challenging to keep up, and gaps and missing data are common. Furthermore, it's likely that the data will be rounded and, therefore, will be far less accurate.
Manual tracking often requires data entry into Excel or some other spreadsheet to make some sense of the data, meaning the data is already outdated by the time it reaches the hands of those who need it. But the depth of that analysis is limited. And human interpretation can be biased.
With MachineMetrics, operators, managers, and other key stakeholders have immediate visibility with real-time, accurate machine data. Because data is in real-time, they have fingertip access via tablets remotely or dashboards at the machine and above the shop floor to understand the actual cause of the failure.
The dashboards and reports are intuitive, providing quick insight into the cause of the downtime and providing quick solutions for action and lowering operating costs.
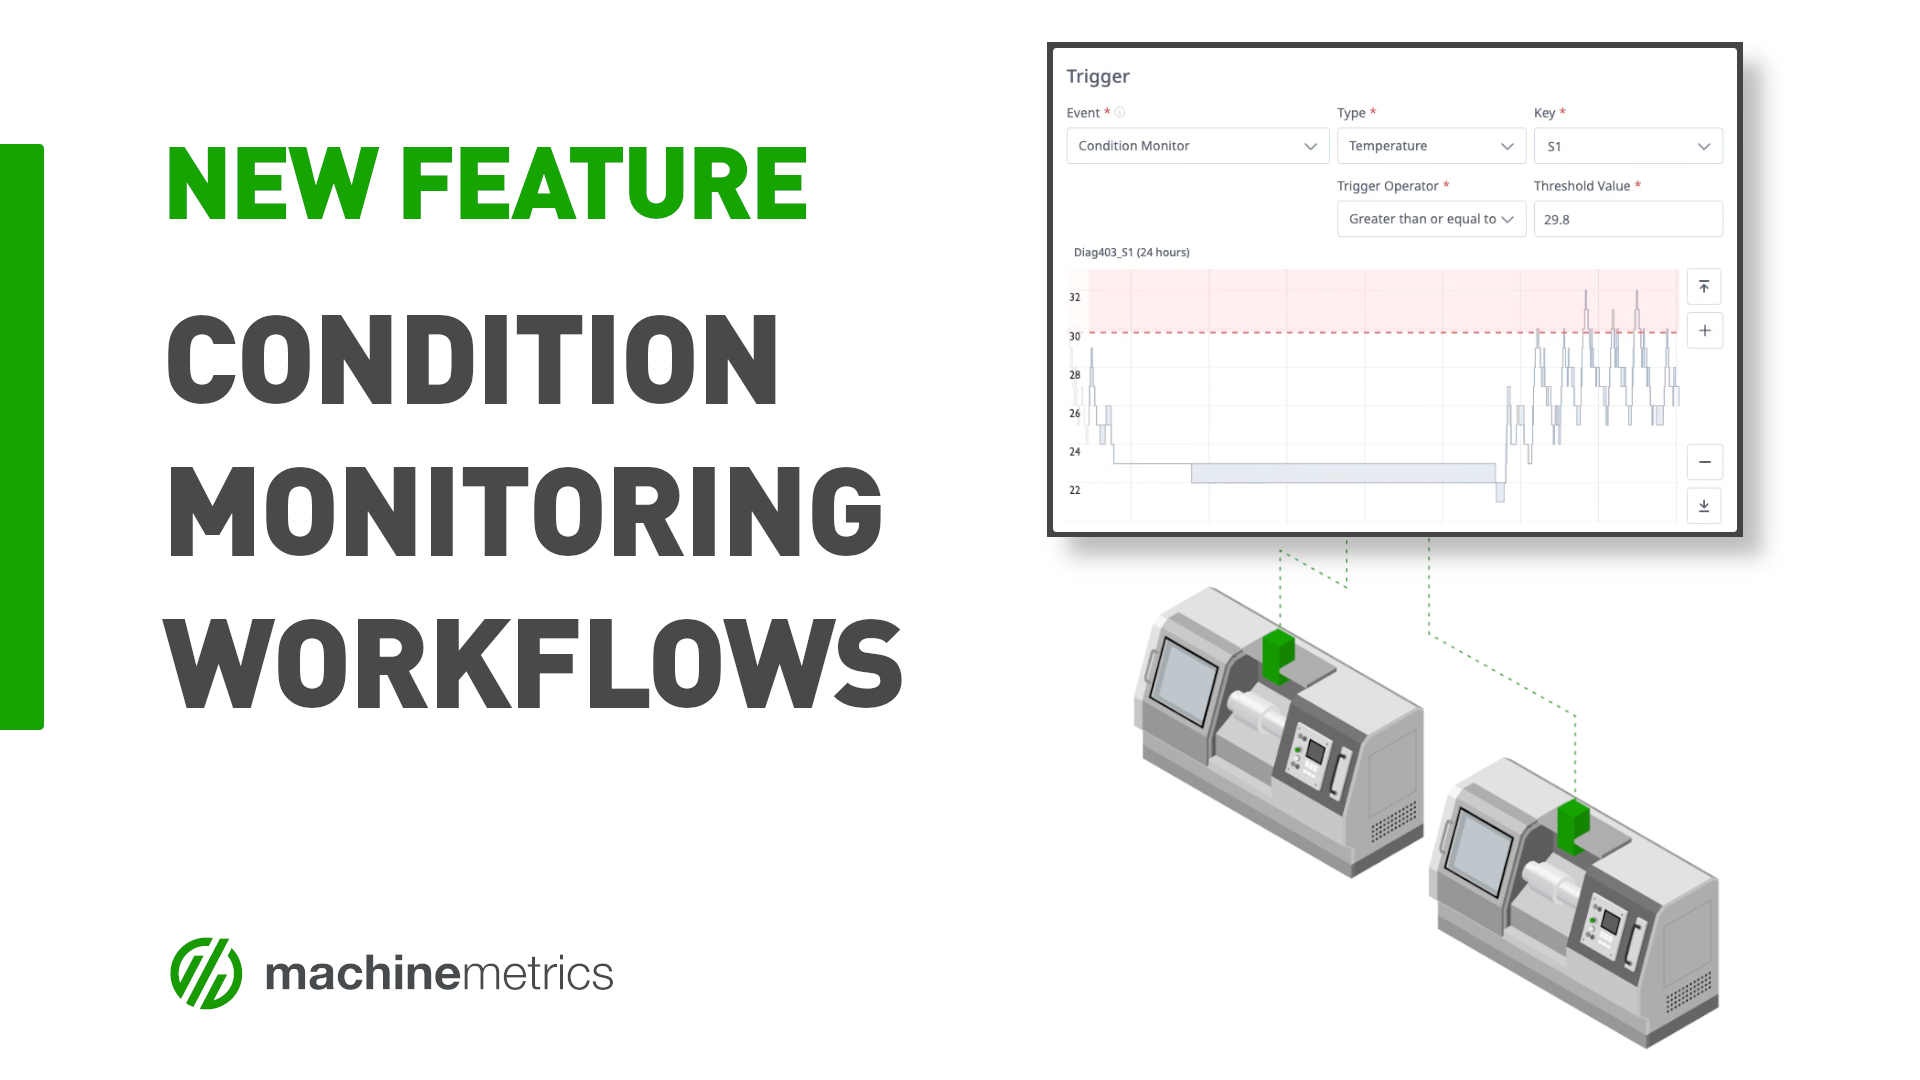
Enabling Workflows and Notifications Based on Machine Events
With MachineMetrics software, machine data can be used to trigger workflows. These powerful tools ensure that the correct information is sent to the right person or automated system for implementing actions. These actions take the form of incidents, notifications, helpful links, or webhooks, and each can optimize processes by enabling fast action when issues arise.
Further reading: Top 10 Workflows for Manufacturers
An incident may trigger an email or text notification to the right person. In the past, operators needed to rely on visual cues, phones, PA systems, or other communication methods to notify others of a problem. Often, the risk was that the person informed was the wrong person for the task. In many cases, the operator may not know what the problem is. With incidents, the correct issue is reported saving time to restart or repair.
Notifications allow communication immediately, saving time and reducing the number of steps to identify and solve the problem. If a supervisor knows the message indicates a lack of feedstock, they can skip the trip to the machine and proceed directly to the bottlenecked process upstream.
Webhooks take the level of action even further. These tiny packets of data may be used to trigger a remedial action by the machine itself. Or they may be used in conjunction with a computerized maintenance management system (CMMS) to notify maintenance teams automatically, check stock for the spare part and order its issuance to the technician, increasing the integrity of the system and speeding up repair and restart times.
Improving Maintenance with Machine Conditions
MachineMetrics can empower a manufacturer to utilize accurate machine conditions to develop condition-based, predictive, or prescriptive maintenance programs. The health of equipment can be assessed at any moment, and operators and managers can save time and maintenance costs by leaving behind reactive maintenance programs.
The result is a vastly improved Overall Equipment Effectiveness (OEE) that reduces downtime and helps improve processes by adding strategically designed maintenance strategies into the value stream. This data is then added to the analytics to allow even more precise optimization of all areas of manufacturing and build confidence in the integrity of the system.
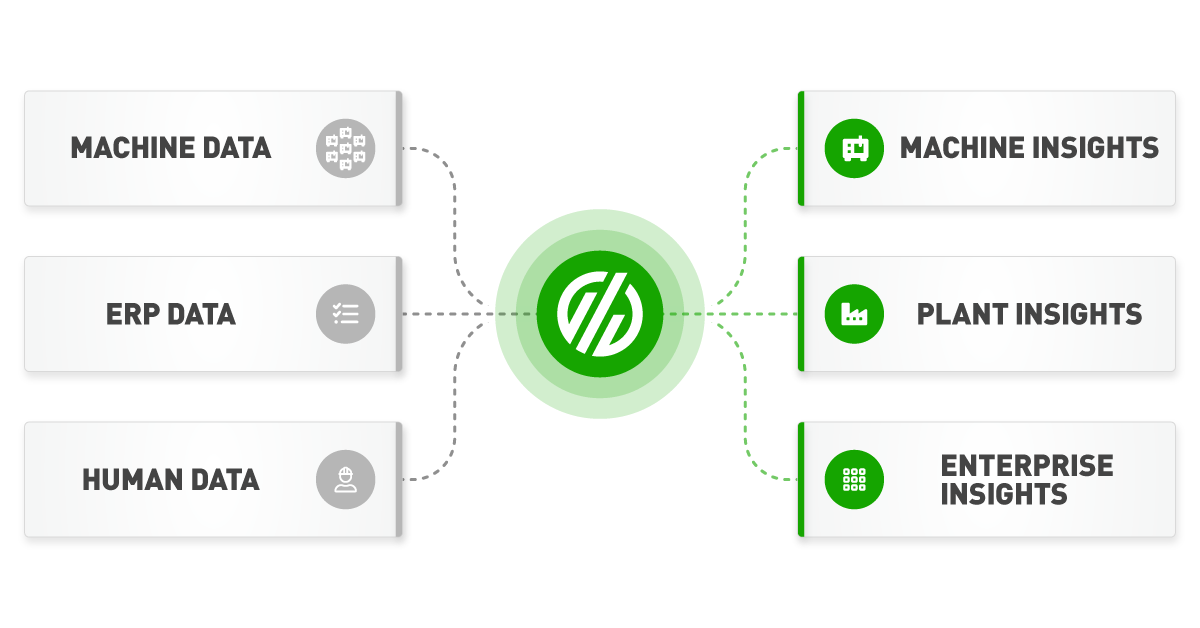
MachineMetrics allows manufacturers to harness the power of data at the machine and factory levels. With a powerful range of Edge devices combined with an AI-enabled data platform, MachineMetrics can supply apps or help you build your own apps and models to drive efficient and actionable insights based on real-time data and conditions to optimize processes in any environment. Contact us today so we can show you how to get the most from your data.
Want to See the Platform in Action?
.svg)

Comments