A digital manufacturing dashboard is one of the most effective tools to use for production optimization in manufacturing.
With better information comes better decisions. A real-time display of the highest priority information using a digital dashboard means that decisions can be made well and quickly.
In this blog, we’ll explore manufacturing interfaces in more detail and discuss how you can use them to track and improve production processes.
What is a Manufacturing Dashboard?
A manufacturing dashboard is a real-time visual interface that provides critical production data for operators, supervisors, and executives. It brings together machine performance, operational efficiency, and other key metrics into a single, easily accessible platform. These benefits come together to support effective data-driven decisions.
As factories become more connected, manufacturers rely on new tools to collect, manage, and analyze production data. Traditional manual tracking methods are too inefficient and error-prone to compete in the modern landscape. Effective production control software is essential to centralize access, monitor workflows, streamline decision-making, and optimize production efficiency. In modern, fast-paced manufacturing environments, your team simply can’t afford to go without these solutions.
Manufacturing dashboards allow users to track important metrics, including machine health, production performance, and workflow efficiency. Instead of reacting to problems once they've already happened, teams can work proactively. With a manufacturing dashboard, they can address inefficiencies, identify bottlenecks, and implement solutions as quickly as possible. The live data streams provided by manufacturing dashboards ensure that teams stay aligned and allow them to achieve continuous improvement.
How Do Manufacturing Dashboards Work?
These dashboards act as the real-time visual representation of processes on the production floor. They offer an intuitive view of production processes and are often capable of customization for each user.
For example, an operator may require a manufacturing dashboard view of each spindle, its position, and its current condition. Meanwhile, A manager may require a manufacturing KPI dashboard that shows the same KPIs for grouped equipment. Executives and planning teams may require a factory view with added costing data.
All users can toggle between views as needed. Operators can zero in on a spindle to trigger an action, while executives can look at the factory view and toggle between quality and cost dashboard views.
How to Choose the Right Manufacturing Dashboard
Choose production control panels based on how effective they are for the user. They should be capable of providing multiple views and types of analytical insights. However, they must also be easy to understand and contain data relevant to the user's job.
Designing a manufacturing interface is a significant consideration, as it determines which manufacturing KPIs are shown in each view. A manufacturing interface template adjusts font, colors, and other parameters to make it easy to read in various conditions.
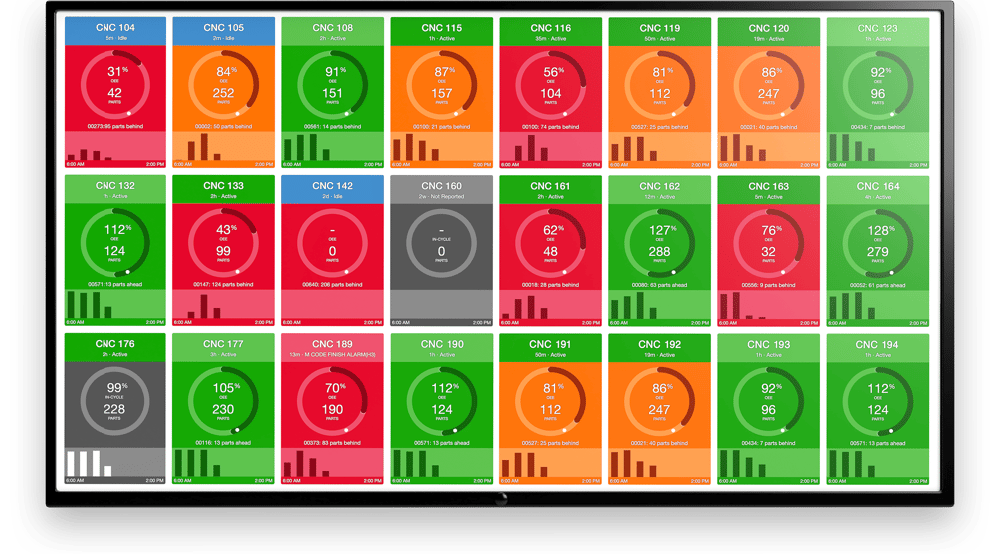
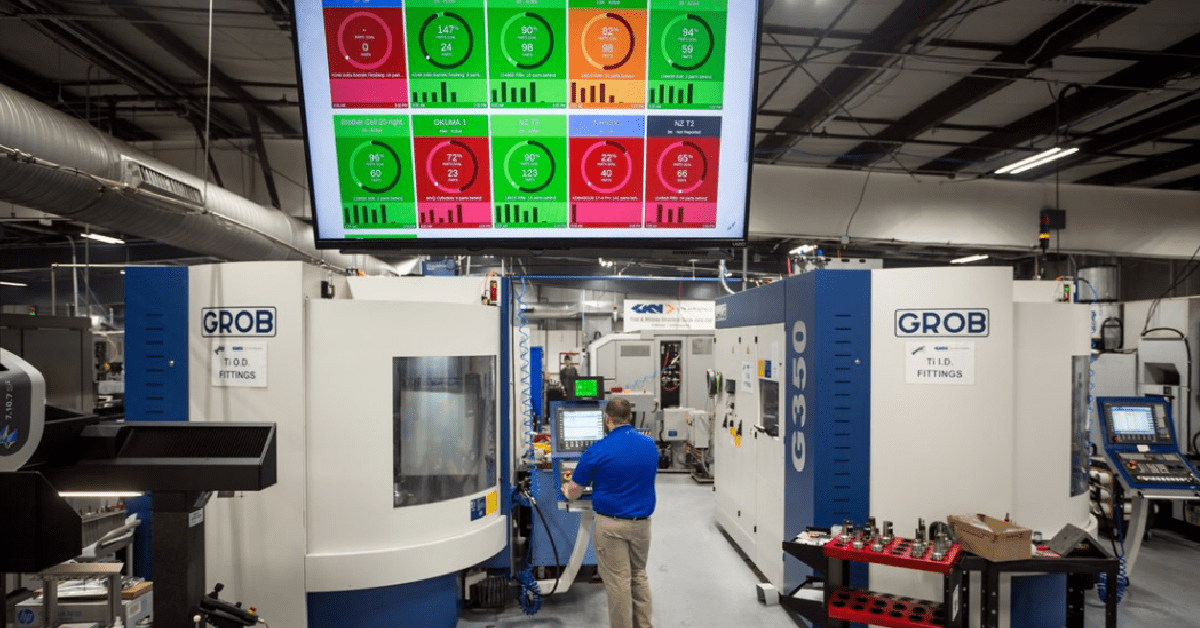
Here is an example from MachineMetrics, which offers a real-time view of shop floor performance. Each cell represents a machine, and the cell's color represents the machine's status and operation.
Most machine data platforms require interactivity between user and machine. This requires careful consideration regarding the placement of data and input areas within the production control panel. This input is critical as some users use a mouse and keyboard while others use their fingers on an HMI, a stylus on a tablet, or even verbal commands.
The right manufacturing dashboard should:
-
Be user targeted
-
Be specific to user needs
-
Contain relevant KPIs
-
Allow contextualization
-
Fully integrated with other software (MRP, ERP, QMMS, etc.)
Most of all, a manufacturing metrics dashboard should seem like an organic and visual representation of the real-time data collected by a machine data platform.
Using a Manufacturing Dashboard to Optimize Production
Manufacturing data may range from simple to complex. A digital dashboard offers a dynamic visual that is easy to understand at a glance. This sort of instantaneous feedback helps improve the overall efficiency of manufacturing operations. It also helps supervisors spot any situations that require attention, offers feedback to floor workers who can adjust their behaviors as needed to meet production goals, and even encourages dialogue between floor workers and management to help better set realistic expectations and voice concerns. They also boost plant utilization and can help unearth the causes behind unplanned downtime and defective products.
 The MachineMetrics Performance dashboard provides instant real-time visibility into the state of the shop floor. The streamlined dashboard gives operators an easy way to see how they are performing against expectations, and allows them to make faster, more confident decisions.
5 Examples for Your Shop Floor
1. Overview Dashboards
Some users require an overview dashboard called a "control tower." This view shows general information on conditions and operations throughout the factory. These high-level views help teams stay on the same page so everyone speaks the same language about current performance.
An overview dashboard will also show how production is progressing that day. Any given user may choose to view historical comparisons by shift, week, month, etc. These comparisons are often color-coded to indicate how current performance compares to past performance.
An overview dashboard may display safety information or quality data such as unit count and first pass yield. Operator performance may be displayed again by shift and past periods. The dashboard may also display breakdowns, upcoming maintenance information, and more.
2. Production Dashboards
A production manufacturing dashboard is a critical component of a connected factory and is highlighted in any machine data platform. The production dashboard shows the status of current production lines. This lets operators know whether they’re meeting their target production rates. It may also display unit counts per hour, quality data (such as rejects, yield, and takt time), and other performance KPIs.
Actual versus expected unit count is a critical component of a production dashboard. Dynamically displaying actual production real-time provides a new level of visibility. Operators and managers can use the dashboard to identify areas where they can intervene, order more material, and add context to the current line condition to improve the production process.
Want to See the Platform in Action?
3. Maintenance Dashboards
As a manufacturing company moves to a machine data platform with real-time analytical insights, it begins implementing advanced maintenance strategies to reduce downtime, improve OEE, and reduce labor and part costs associated with repairs.
A maintenance dashboard can draw on these real-time insights to dynamically identify repair and service requirements before they become an issue. This information may be due to context added by an operator at another HMI or through the automated identification of trouble spots based on temperature and vibration analysis.
A maintenance dashboard is an integral part of a predictive maintenance strategy. It allows technicians and managers to plan and optimize maintenance processes just as other dashboards allow production, planning, inventory, and other departments to optimize theirs. The common thread is that data-driven insights enable everyone to speak the same language and work in a common direction.
4. OEE Dashboards
An overall equipment effectiveness (OEE) dashboard helps managers understand equipment availability, whether production goals are being met, and what problems are holding production back.
A manufacturing OEE dashboard can display the OEE for a single machine, a group of machines in a department, or all connected equipment within a facility. Since the assets are connected to a machine data platform, OEE calculations are automated and in real-time. This provides dynamic KPIs that can be compared to historical periods.
The manufacturing OEE dashboard can identify machine problems, enabling staff to implement a process improvement or optimization. The change results are dynamic; the team can decide whether further intervention is required or if the change has the intended effect.
5. Quality Dashboards
A machine data platform helps manufacturers move production quality control measures from an inspection-based program to an automated program. A quality dashboard draws on the same real-time data insights and leverages that data to target improvements.
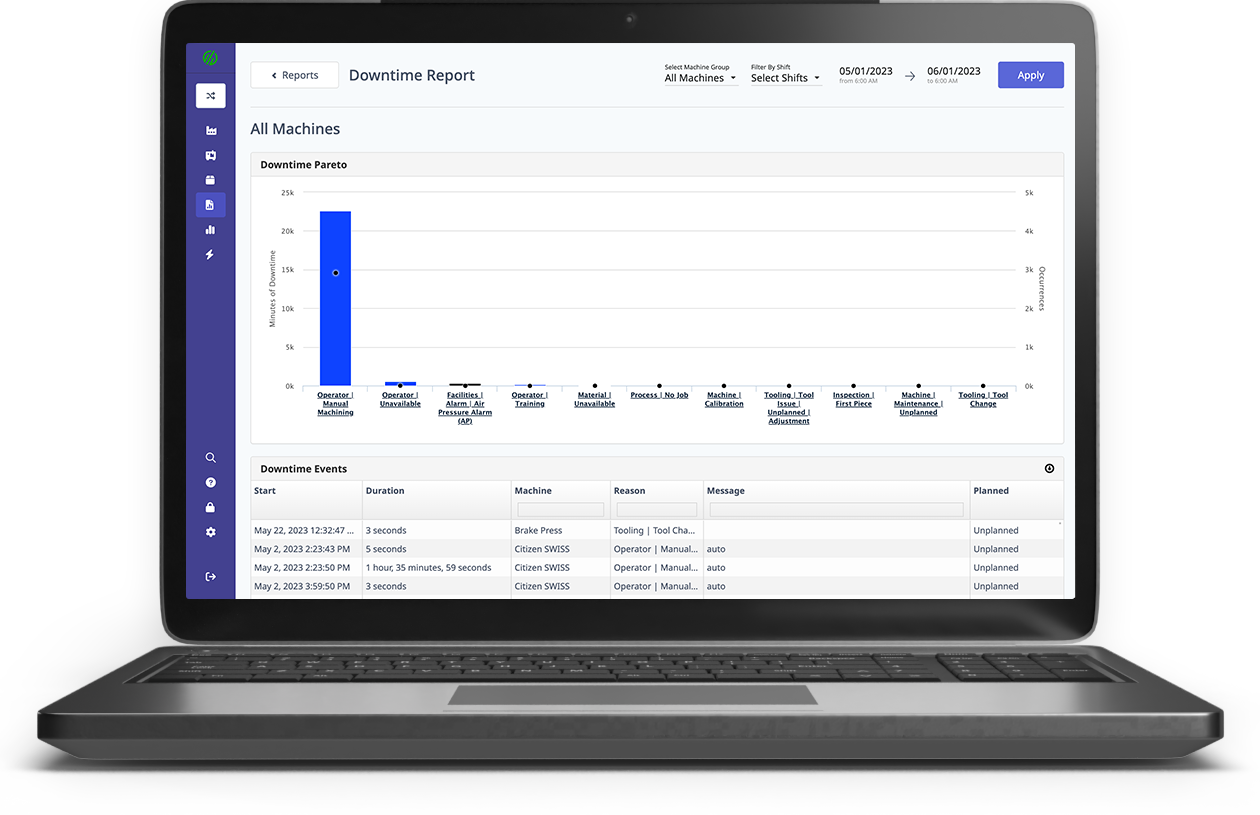
A quality control dashboard commonly includes the total production for the period and the current defect or rejection rate. It may also include cycle time, trend analysis, and charts or graphs that dynamically display the cost of quality, defects by category, and other quality KPIs that ultimately impact production volume, customer satisfaction, and other critical business success metrics.
Defects by category can be tracked by the hour or shift, and users can drill down to compare against previous performance in a specific category.
Replacing Your Whiteboard with a Digital Manufacturing Dashboard
The whiteboard has been a staple on the factory floor for years, increasingly so as lean manufacturing became the status quo.
"You can't manage what you can't measure."
- W. Edwards Deming (Statistician & QA Expert) or Peter Drucker (Management Consultant), depending on who you ask
This whiteboard was usually mounted on a wall in a central location and smudged with faded colors where leadership erased and updated the info a few times a day and many times per week. Updates came sporadically, sometimes hourly, sometimes by shift. Tracked stats might include planned vs. actual production numbers, important notes about anything that occurred (or simple motivational scribbles), and a sign-off from whoever added the notes.
Of course, because these numbers get erased frequently, if someone forgot to log the information in a new location, then those numbers were often lost to time. Not to mention that the numbers were often wrong to begin with due to human error or forgetfulness. Similarly, poor handwriting sometimes made numbers unreadable, leaving high-priority stats to a squinty guessing game.
Reasons to Move Past Traditional Whiteboards
This whiteboard is the predecessor to the modern production control panel. However, more than a few improvements have been made since the analog days. Digital dashboards win over whiteboards for many reasons, including:
-
-
Automatic calculations—How many parts does a shop floor employee need to complete to meet the day’s goal? Are they ahead of schedule? How many minutes ahead or behind schedule is the floor as a whole? How many defective products have been manufactured at each station and overall?
-
Machine precision ensures stats are accurate and readable.
-
Long-term trends can be seen using data that is logged continuously (rather than erased), even after it no longer appears on the screen. These factors can be used to gain valuable insights or make predictions using numbers rather than intuition alone.
-
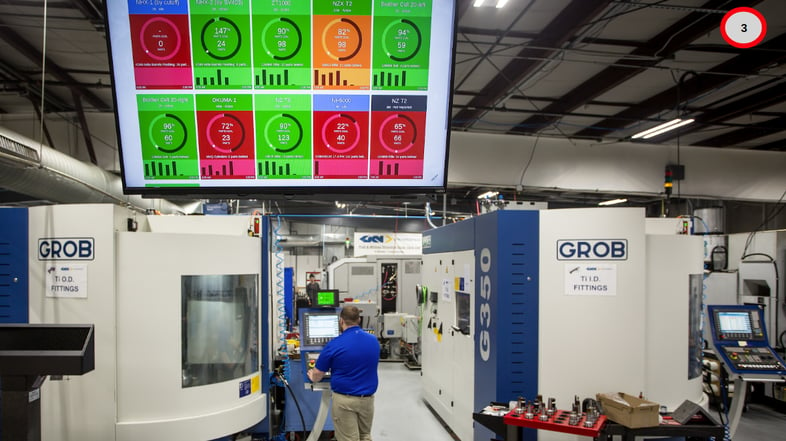
Literal visibility from across the shop floor thanks to large, high-definition screens often used to display digital manufacturing interface, so everyone can see how they’re doing in real-time.
-
Remote viewing capabilities enable leadership to stay apprised of shop floor data even when they are away from the facility via their smartphone, tablet, or laptop.
Unlocking Real-Time Insights
Manufacturing interfaces are a valuable analytics tool for lean manufacturers when used wisely. When a manufacturing metrics dashboard displays the most immediately understandable, relevant, high-priority information, workers can do something with it.
However, dashboards like the one used in MachineMetrics are customizable based on need. They offer a solution for both immediate information about utilization and production numbers visible to the shop floor or long-term trends to show investors and stakeholders and decision-makers. Manufacturing dashboards can be configured with the most relevant information for the audience at hand. Color coding makes these types of dashboards easy to read and understand quickly without the need to go into all of the unneeded technicalities in most situations.
As for the numbers that make digital dashboards function, that data must be collected from the shop floor. For example, machine data captured using the MachineMetrics High-Frequency Data Adapter can be used to understand utilization trends, possible machinery complications that require maintenance, production capacity, and much more. A data collection rate of 1kHz (that’s 1000x faster than other sensors on the market) ensures the highest fidelity. With our data transformation engine, all types of machine data can be collected and put into a standardized data structure so you can get actionable insights that much faster.
Manufacturing Dashboards With MachineMetrics
 The MachineMetrics IIoT Platform collects machine and operator data, and displays it in performance dashboards that are available both on the shop floor as well as remotely.
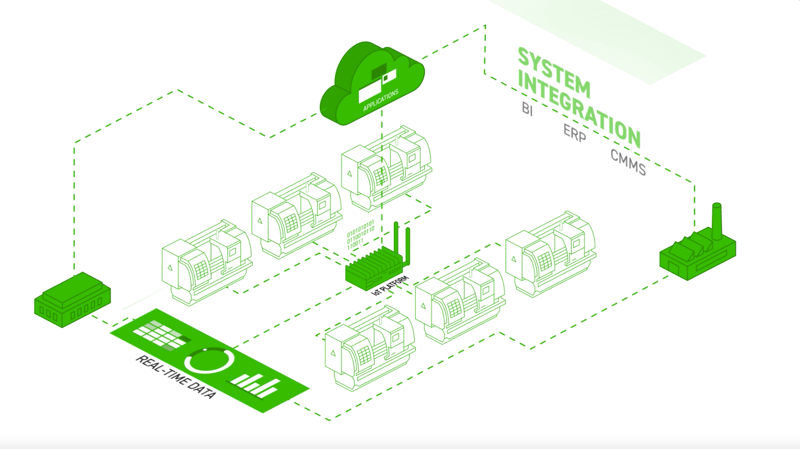
The MachineMetrics Machine Data Platform collects machine and operator data and displays it in performance dashboards available both on the shop floor and remotely.
Edge computing (learn more about how edge computing is used in manufacturing) is used to analyze data on-site for real-time predictions and other insights. Remote data storage via the cloud lets you collect and store all types of information for later, more profound analysis. It’s easy to pull whichever data is most relevant and meaningful to the questions you want to ask rather than wading through endless, unhelpful numbers. Then, automatically pull that info into easy-to-understand dashboards tailored to your audience.
Measure and analyze what’s most important to your specific production KPIs so you can make informed decisions and faster predictions at every step of the manufacturing process. Show what’s most important through a color-coded dashboard that gives an at-a-glance visual representation of even complex data.
How Can MachineMetrics Help?
From simple machine monitoring and performance dashboards and manufacturing KPI dashboards to advanced analysis based on your historical data, MachineMetrics’ Machine Data Platform transforms shop floor insights into actions. Our plug-and-play solutions will make it easy to connect your machines quickly, with access to the data in a matter of minutes.
Ready to connect your shop floor?

.svg)


.png?width=1960&height=1300&name=01_comp_Downtime-%26-Quality_laptop%20(1).png)
Comments