
Book a Demo of MachineMetrics
The leading platform to collect, monitor, analyze, and drive action with machine data. Set up time with a product specialist to learn how we can help your operation.
Ready to empower your shop floor?
Learn More.svg)

A bottleneck analysis is an important process in manufacturing that can help remove or mitigate production holdups, drive efficiency, and improve overall equipment effectiveness (OEE). Managers can use the bottleneck analysis to gain insights and implement process improvements designed to eliminate the issues.
Below, we’ll discuss this process in detail and explore a real-world case study of how one manufacturer identified manufacturing bottlenecks on their shop floor.
A bottleneck in manufacturing is a constraint where upstream work in batches or on a production line arrives faster than the overall production line can handle. The congestion is like the neck of a bottle, or a funnel, that creates inefficiency and drives up costs through increased handling and lower equipment utilization in downstream equipment.
Short-term manufacturing bottlenecks are temporary in nature and have a minimal impact on production operations. They usually consist of random course-of-business events that can’t be anticipated by a production system or production monitoring software. Short-term bottlenecks may resolve themselves or may need to be corrected once to eliminate the need to address the concern again.
Long-term bottlenecks create unnecessary downtime and reduce production efficiency and morale. They’re often caused by outdated or un-automated equipment, but maintenance can also contribute to them.
Manufacturing bottlenecks can occur at almost any point in a production process, and while the list of examples is long, identifying them and finding a solution is possible.

Manual change orders can create bottlenecks as changes move slowly through the system. They may also not arrive at all machines at the same time. Automated workflows and standard work mean new information and instructions are available immediately to all who need them.
 Integrating the systems, machine, and people on a shop floor can reduce bottlenecks thats result from technology siloes.
Manufacturing bottlenecks can occur from a variety of sources, each with its own dynamics and solutions. These sources include:
Communication between teams or departments is critical. When these communications are verbal or paper-based, they can cause a bottleneck in manufacturing. This type of bottleneck may be as simple as an operator going on a break or a lost clipboard. This can be solved by deploying automated machine data collection solutions.
![]()
Manually collected production data is time consuming and error prone, leading to poor communication and insights.
Manually collected production data is time-consuming and error-prone, leading to poor communication and insights.
Technology bottlenecks often occur with fragmented software systems in siloed original equipment manufacturer (OEM) machinery. If these systems have no interoperability, the time required to program settings at each production step creates a bottleneck in manufacturing. If a programmable CNC machine is in the production stream before a manually set drill press, the technology is mismatched, prohibiting communication and interrupting the workflow.
Integrating the systems, machine, and people on a shop floor can reduce bottlenecks thats result from technology siloes.
The effect of bottlenecks can be analyzed across several categories. First, bottlenecks cost time: machine time, higher lead times, and more. All that time reduces available production capacity for more orders and drives up the cost per unit of production.
Finally, bottlenecks cost money. All the examples above have a dollar value that can be staggering. The cost of a long-term bottleneck in manufacturing can range from hundreds per hour to thousands or even hundreds of thousands, depending on the industry and size of the enterprise.
Analyzing bottlenecks has several key benefits. For one, it helps eliminate waste. Any constraint that slows or stops production will generate waste in the form of labor, material loss, or capacity loss. A practical bottleneck analysis will help eliminate this waste.
A second benefit is increased knowledge among managers. By understanding the reasons for the manufacturing bottleneck, managers can not only correct existing bottlenecks but also helps in the design of future production lines or production expansion.
| Increasing OEE by 30% and Capacity by Millions: Learn how instant shop floor visibility resulted in a 30% increase in OEE, a more effectively leveraged workforce, millions of dollars in increased capacity, and increased throughput via the reduction of bottlenecks. Watch the full video featuring OEE Director Matt Townsend. |
Bottleneck analysis requires looking at the entire production process. While data and performance on each piece of equipment in the line are needed, the bottlenecks often occur during the transition, staging, communication, or setup phase.
Conducting a production capacity analysis requires a tremendous amount of data collection to be effective. This means collecting production data, collating it, standardizing and analyzing it for trends, and spotting the areas where bottlenecks occur.
There are many well-established strategies available to identify and resolve bottlenecks on the shop floor. We document several of these below:
A fishbone diagram approaches the cause and effect of a bottleneck in manufacturing. The problem is the "head" of the fish, and the causes feed into the spine. This is an effective tool that helps teams visualize the problems as they iterate solutions.
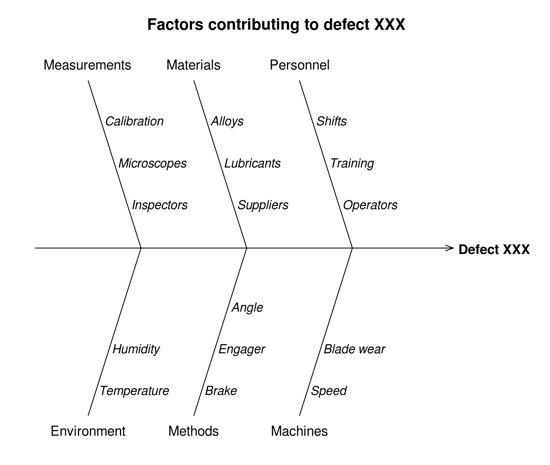 A fishbone diagram, also known as an Ishikawa Diagram, shows the factors contributing to a problem. [Image Source]
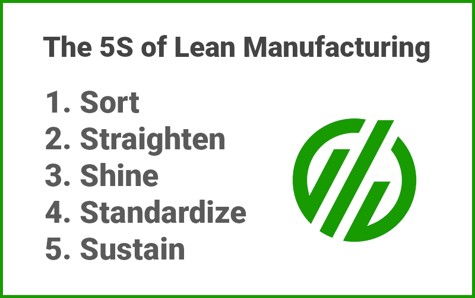
By addressing the physical space, constraints can often be uncovered and addressed. 5S Framework – most have heard of the sort, set, shine, standardize, sustain components of 5S framework in the context of lean. It’s a hands-on physical and easily visualized tool when conducting an analysis.
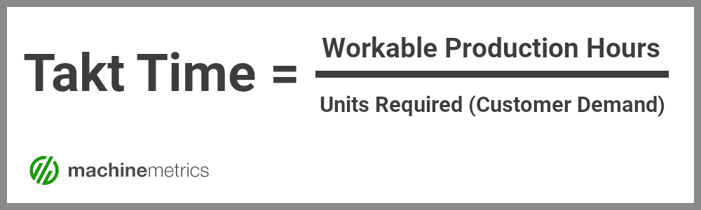
Any bottleneck analysis will include measurements of takt time, the time required to produce a product, and the materials, labor, and equipment available. An optimized takt time will act as a benchmark and will help identify maximum capacity and labor constraints.
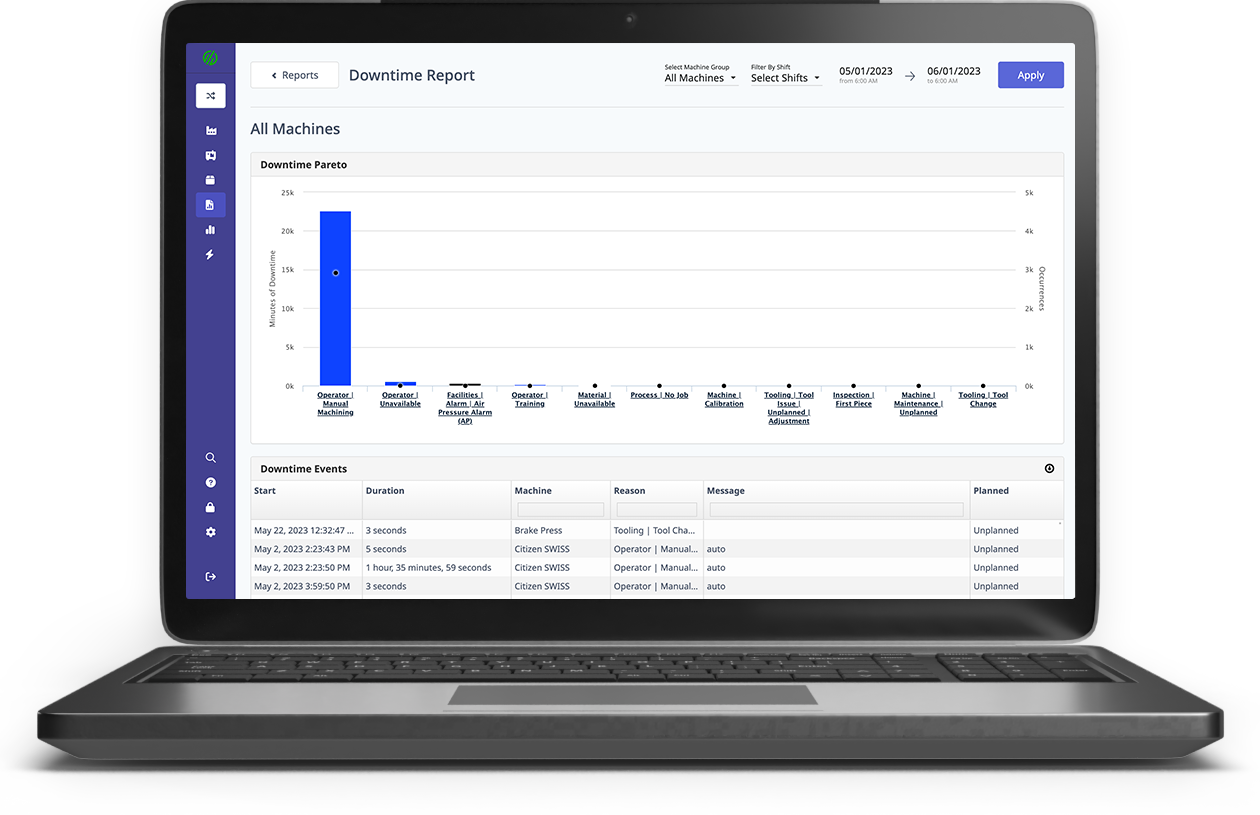
Avalign Technologies, a medical device manufacturer with facilities across the US, was experiencing difficulty in tracking OEE and machine downtime, leading to issues on the shop floor that included poor machine performance, unclear standard operating procedures, and production bottlenecks.
MachineMetrics is helping Avalign pursue its goal of providing best-in-class medical equipment by giving the company full control of machine and operational data to build a strong, competitive advantage in the marketplace.
Ready to empower your shop floor?
Learn More

.png?width=1960&height=1300&name=01_comp_Downtime-%26-Quality_laptop%20(1).png)


.gif)


Comments