
Book a Demo of MachineMetrics
The leading platform to collect, monitor, analyze, and drive action with machine data. Set up time with a product specialist to learn how we can help your operation.
Ready to empower your shop floor?
Learn More.svg)

As the employees closest to production, operators have deep visibility into the shop floor. On the other hand, other stakeholders including shop floor managers and manufacturing engineers sometimes struggle with visibility into the status of production, how a team is performing against production goals, and how efficiently your equipment and resources are being used.
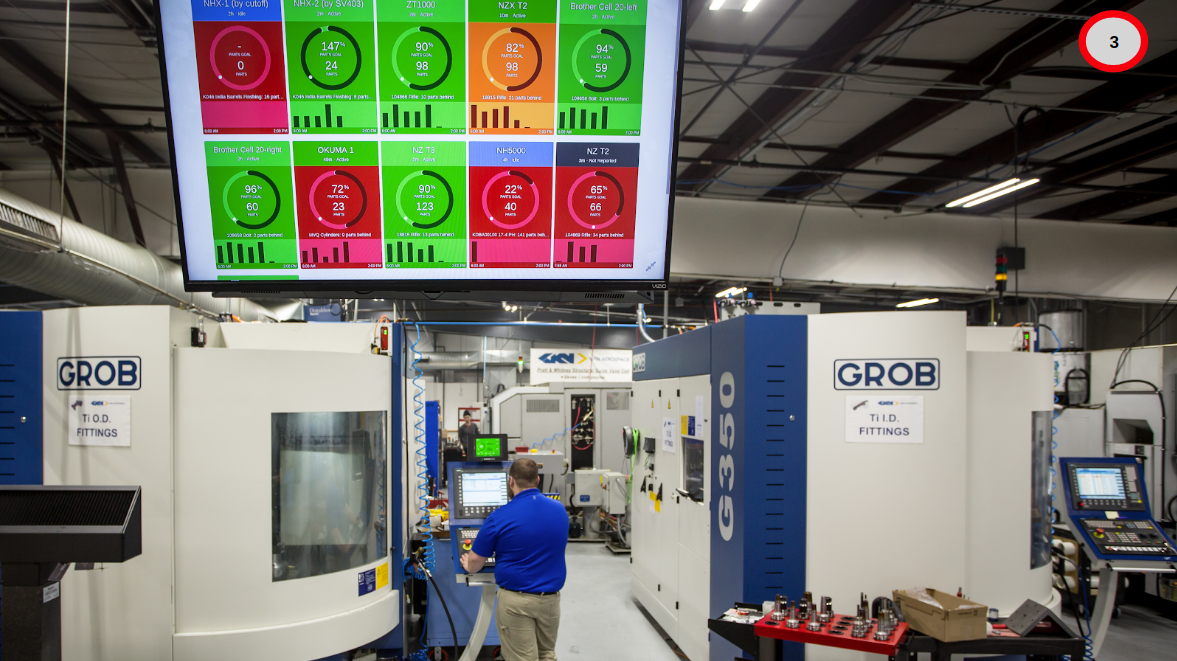
Fortunately, connected devices provide data, analytics, reports, and communication tools to shine a light on production problems found in traditional manufacturing.
One of the most common challenges managers face is machine downtime, the time a machine isn’t in production. But what is machine downtime? When analyzing the biggest causes of a company’s production downtimes, significant gaps in knowledge are observed.
Answering these questions is part of a downtime analysis. Shop floor managers, process engineers, and other stakeholders can pull together data from the shop floor to run analytics and identify issues, opportunities, and other insights in an effort to reduce downtime.
Though it likely goes without saying, manufacturers need production data before they are able to run a downtime analysis.
Traditionally, manufacturers have tracked downtimes manually with pen and paper, whiteboard, or with an Excel sheet. Often, it’s imported later into an MES or ERP system. But to comprehensively answer the question, “What is machine downtime?” you must first understand the problems with traditional machine downtime tracking.
The problem with machine downtime tracking, especially when attempting to conduct a downtime analysis, is that manually collected data is generally inaccurate and delayed. This not only prevents operators and managers from acting quickly on the data but results in a skewed view of the actual production performance of the plant.
For example, operators might not bother reporting downtimes that are common, such as tooling changeovers. Even when downtime is reported, critical details might be forgotten or left out of reports on it. Busy operators might simply document that the machine was down with a gut feeling about the duration.
Furthermore, manual data collection is time-intensive and requires unnecessary data compiling. Not to mention, those conducting the analysis are likely to be lost in uncontextualized data that requires far more effort to understand and use effectively.
![]()
Automating the collection of data and ensuring its accuracy is not only necessary to conduct a successful audit but also provides a foundation for effective decision-making to reduce machine downtime that reaches far beyond downtime analysis alone.
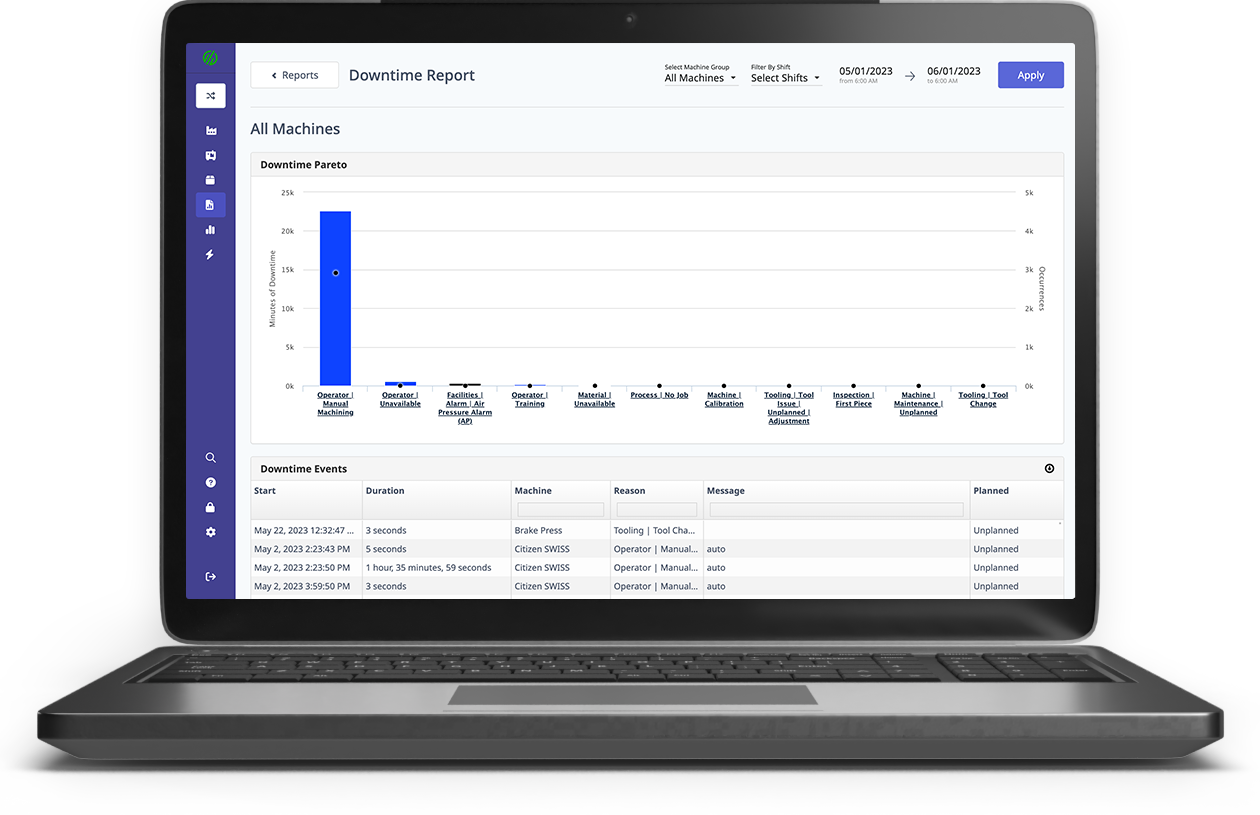
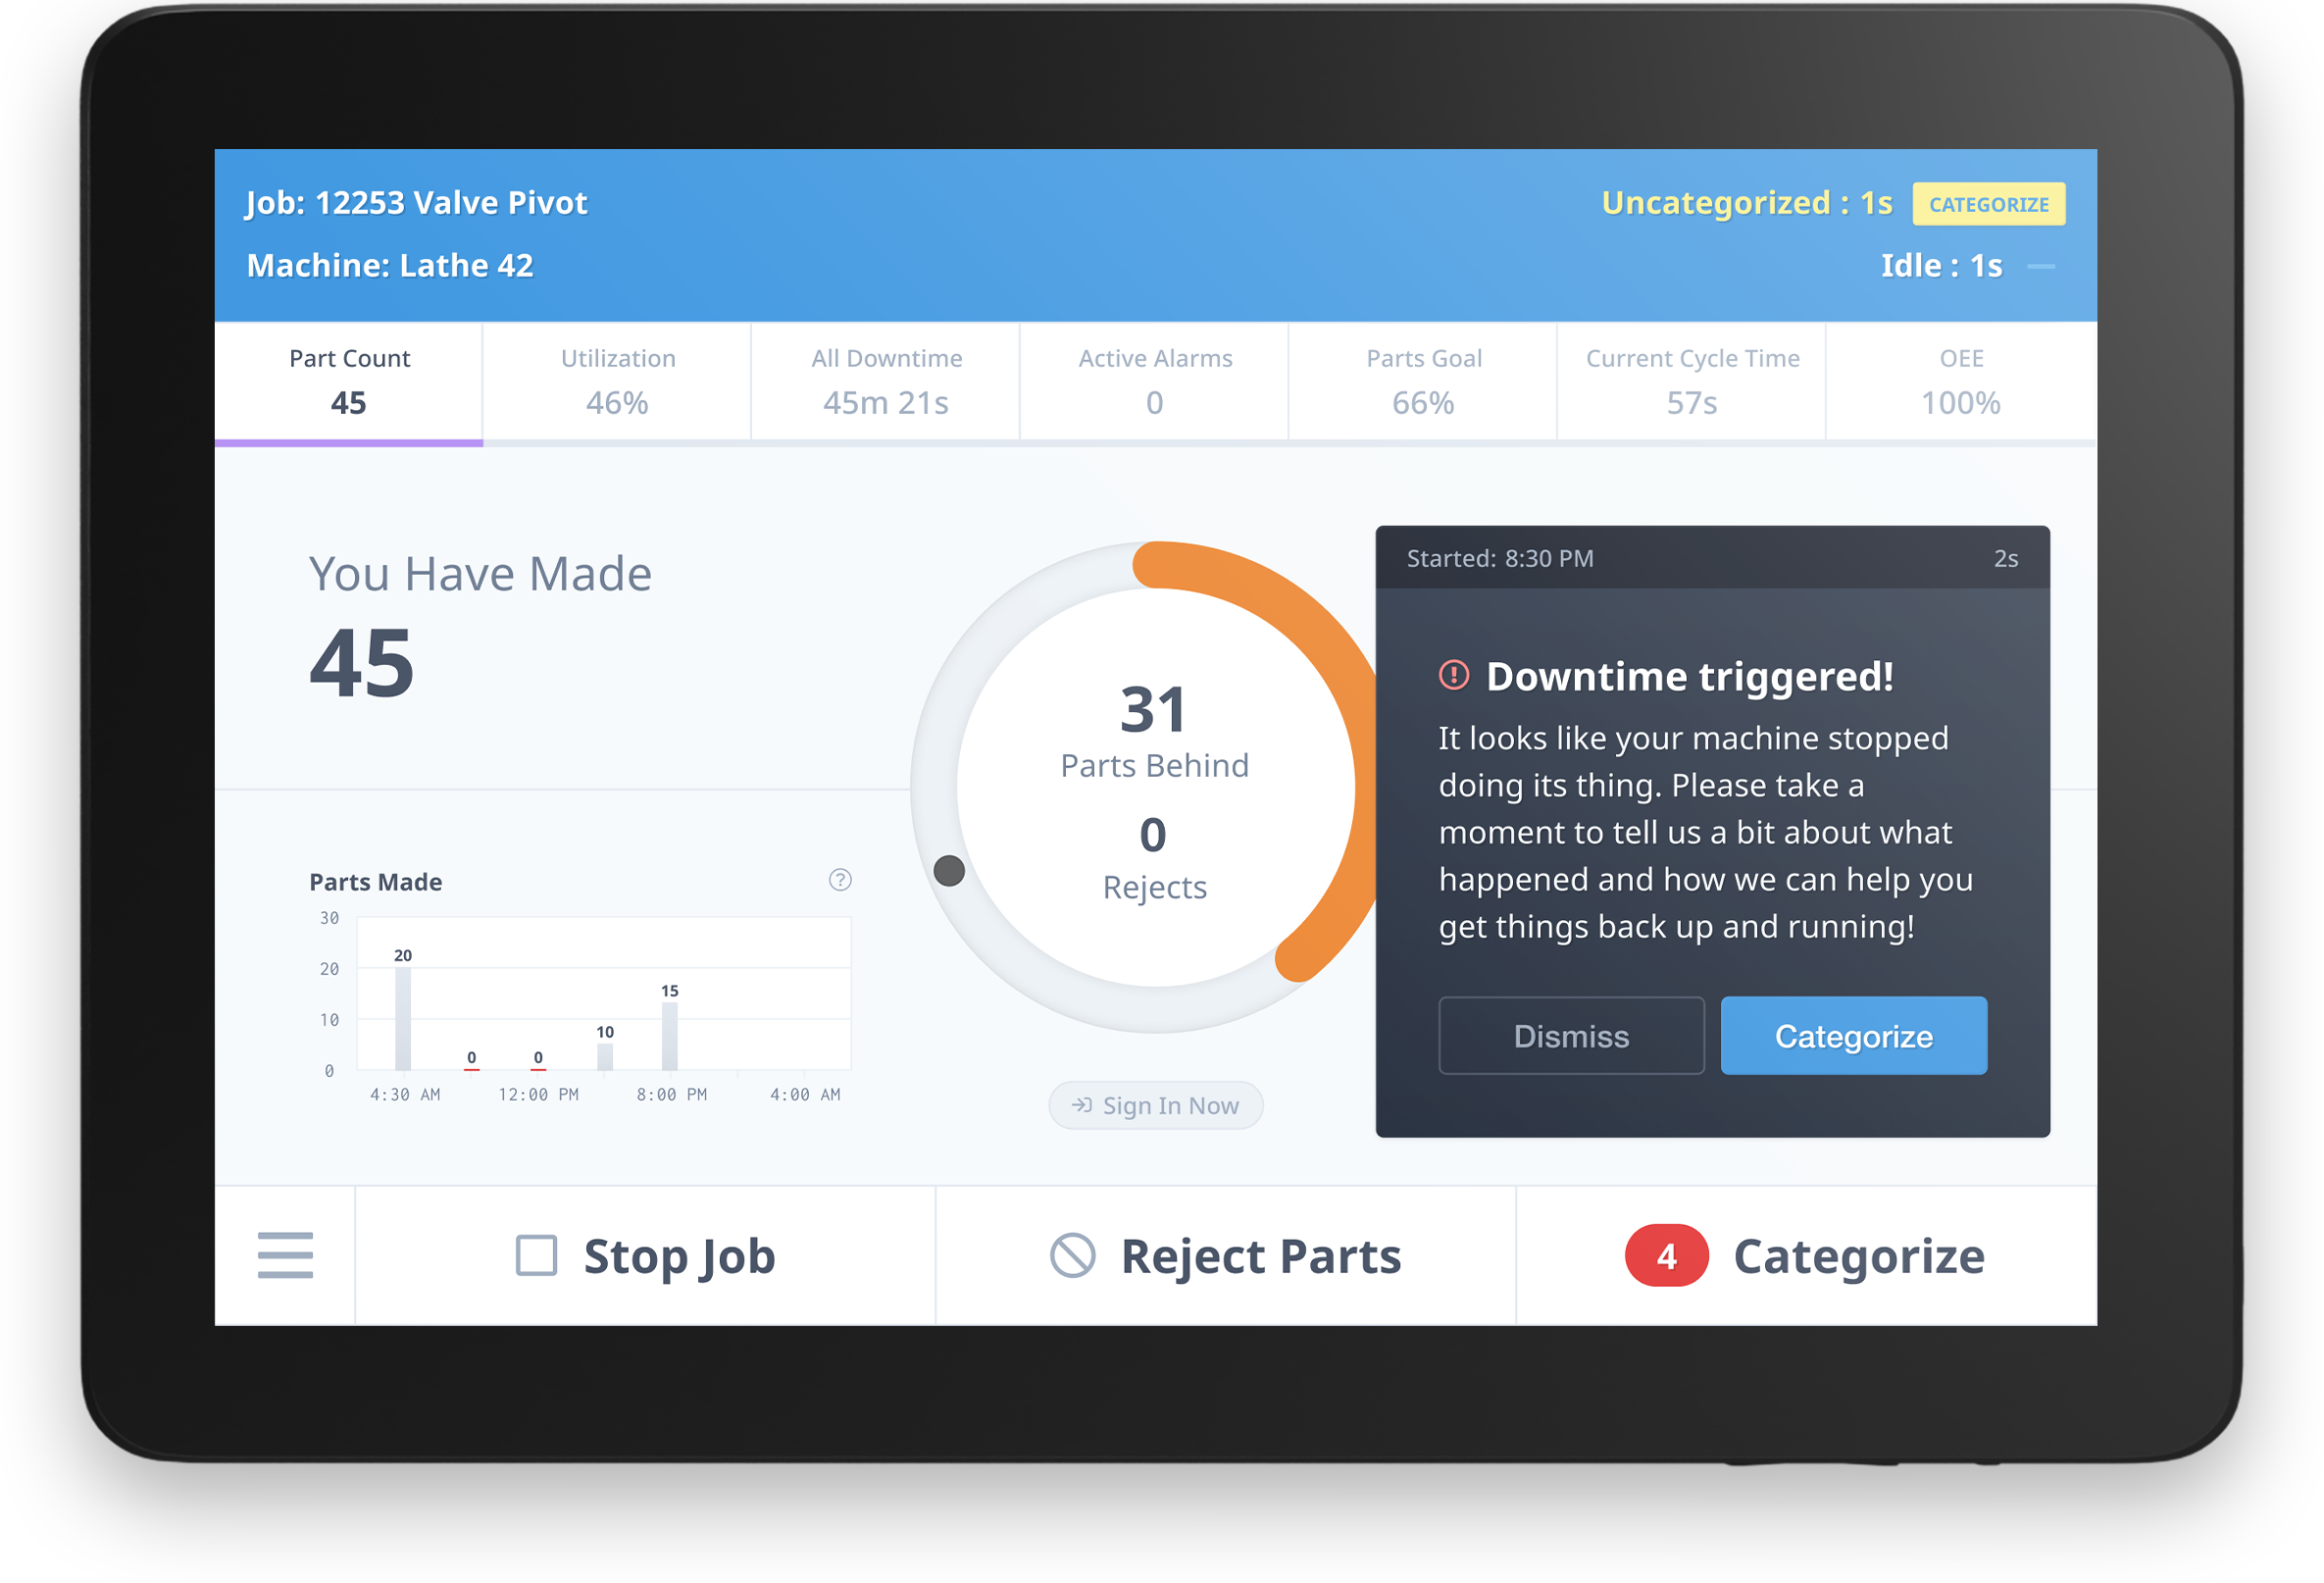
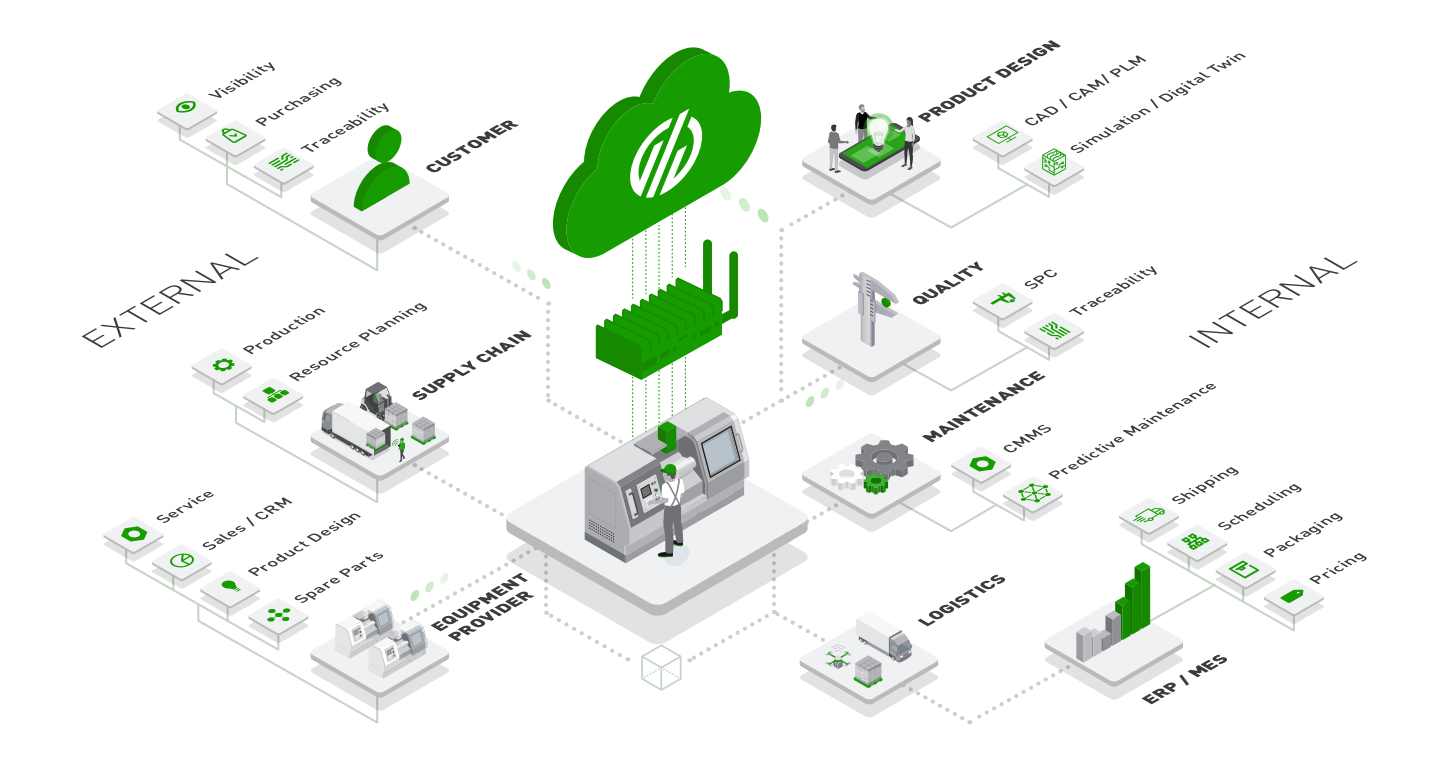
Leveraging a solution like MachineMetrics gives manufacturers the ability to automatically capture accurate machine data in real-time. Our plug-and-play solution connects directly to the machine control and also collects contextual data from operators via tablets placed at each machine.
In this way, manufacturers not only have accurate downtime data directly from the machine but also data that explains the “why” behind these downtimes, allowing them to reduce machine downtime. Further, out-of-the-box reports and dashboards can easily be consumed by operators, managers, and even the C-Suite to better understand production performance and act on data in real-time.
A helpful read: What is Downtime Tracking Software and Why Do You Need it?

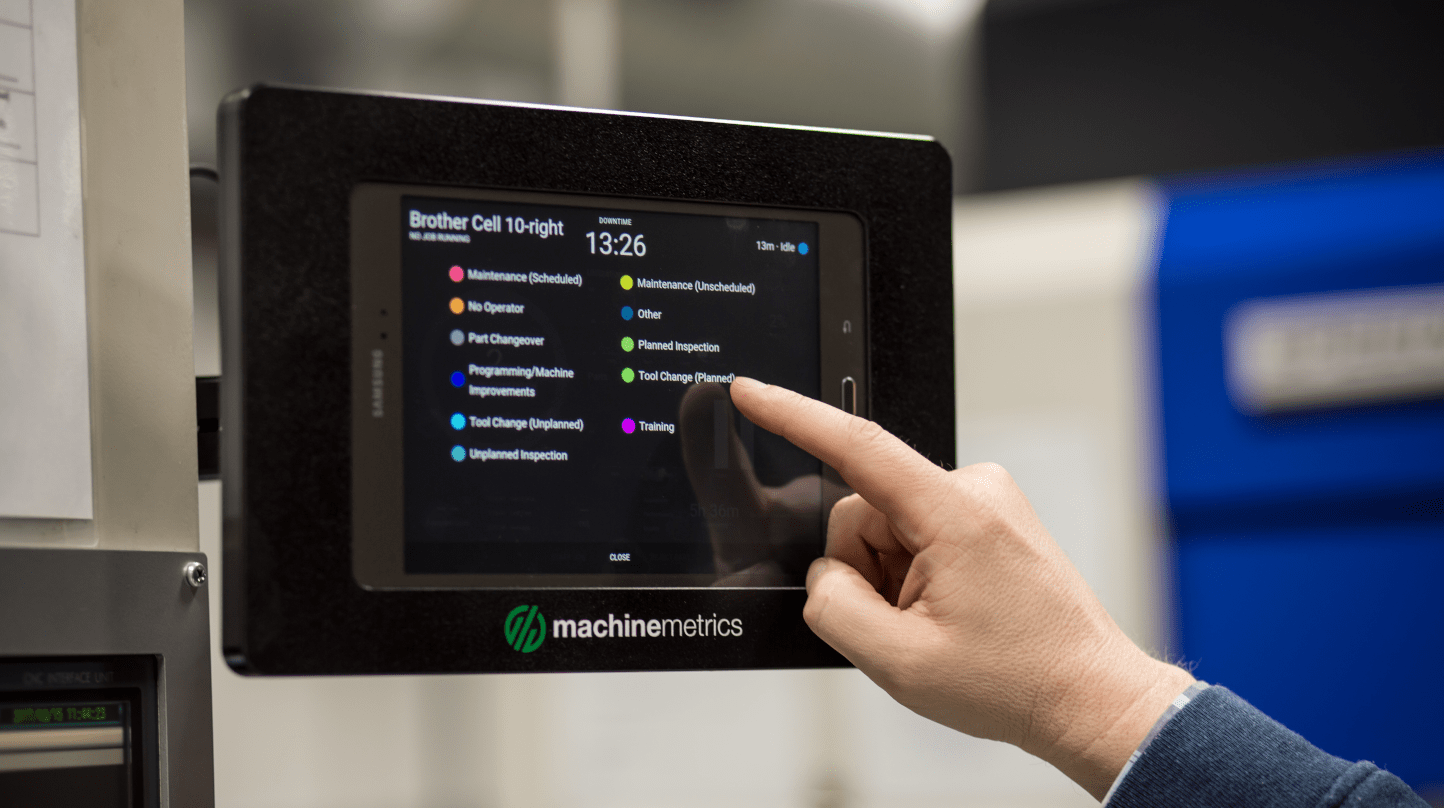
For effective machine downtime monitoring, there's a variety of information you will want to collect from both your machines and operators in order to run an effective downtime analysis, including:
Additional information may be included to provide context on why the downtime occurred (i.e. the downtime category is “Machine Fault,” and additional information may explain that there was a bar feeder jam).
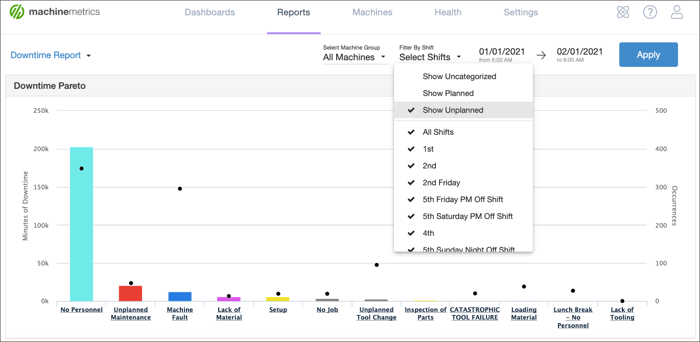
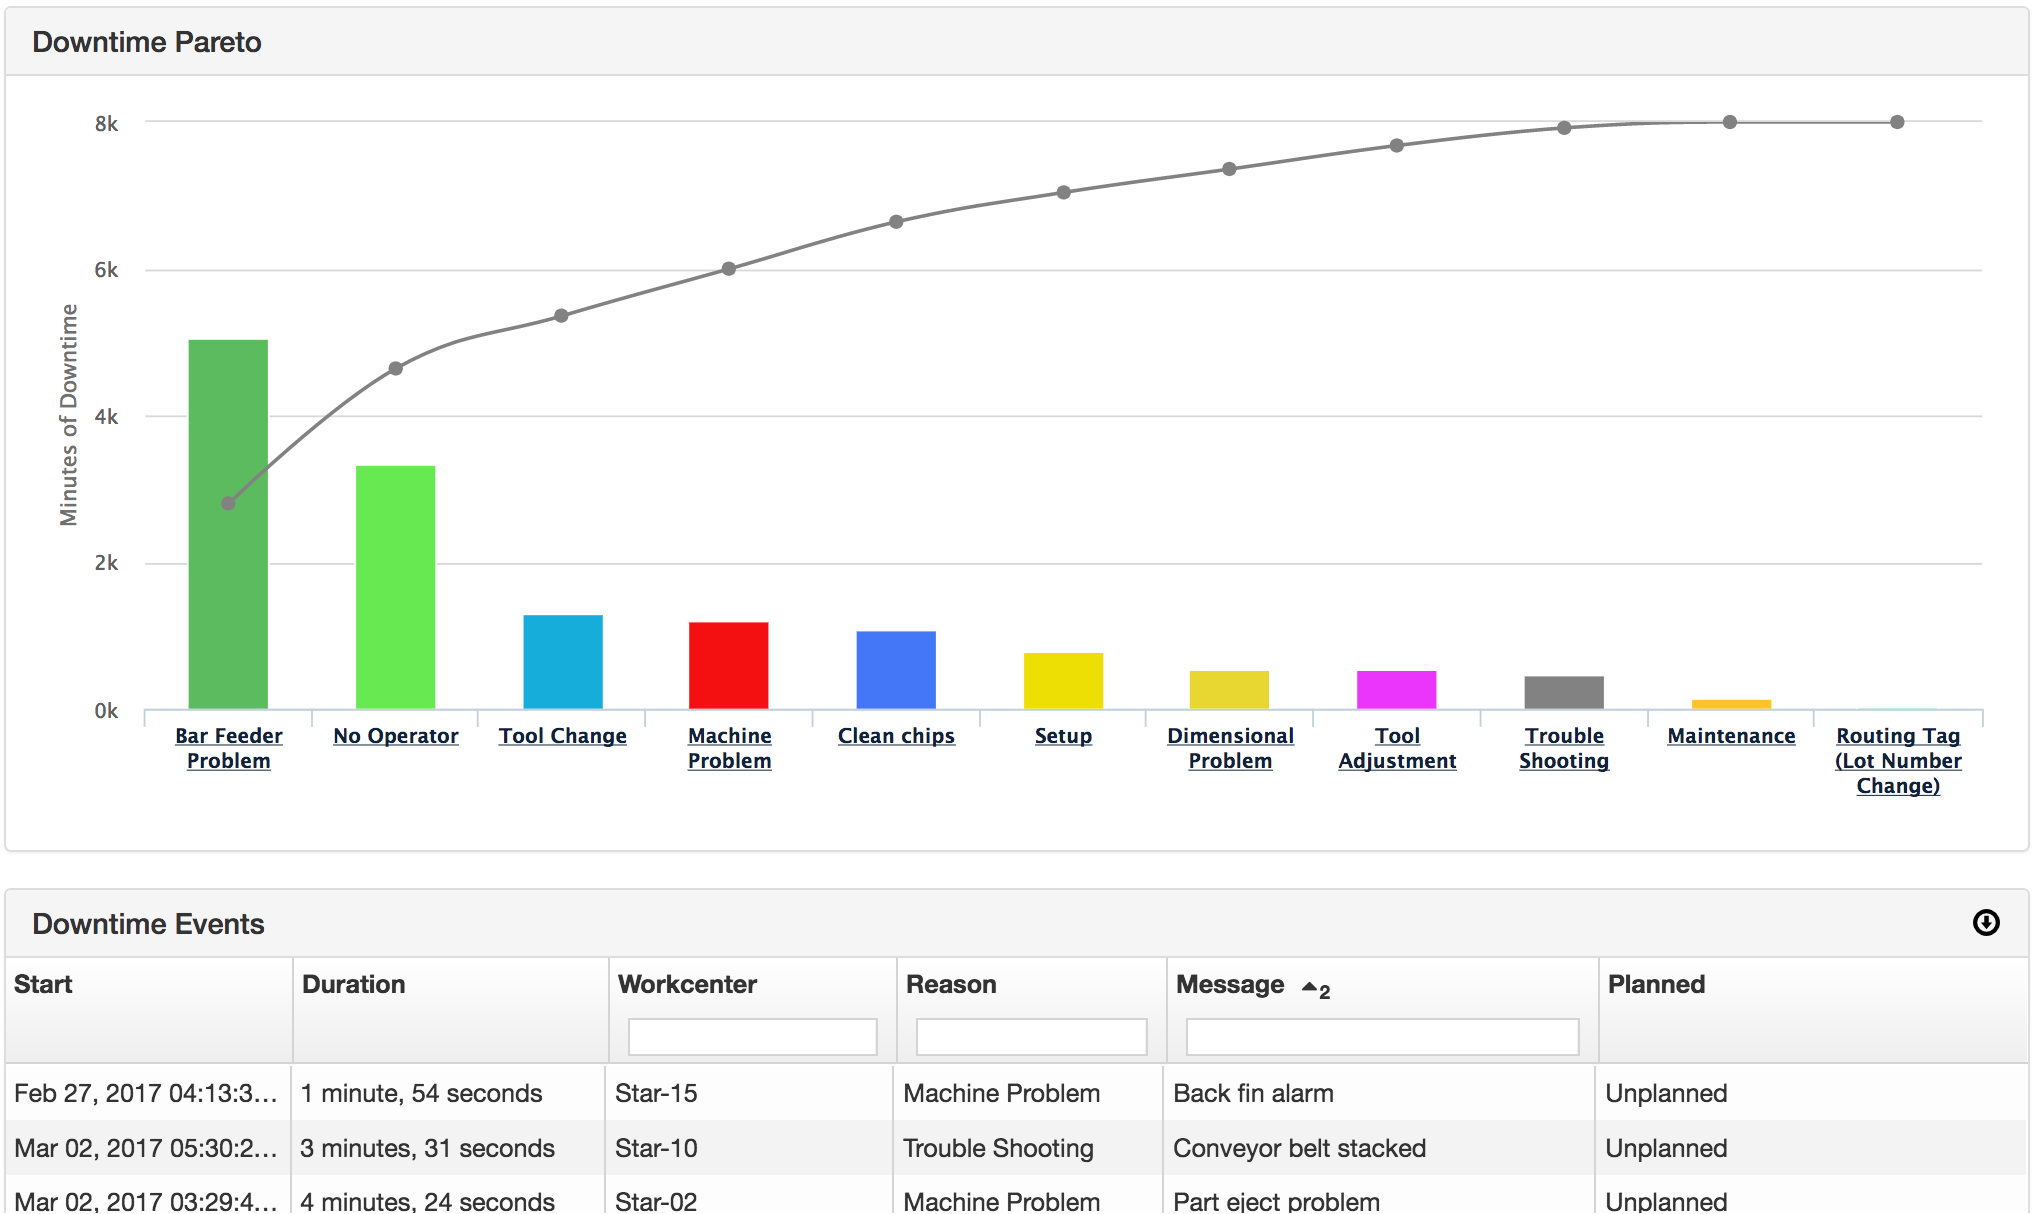
One of the most useful machine downtime reports for understanding downtime reasons is the Downtime Pareto, which will aggregate all the logged downtime reasons.
With this report, you can easily identify the most egregious downtime reasons. Furthermore, you can segment the data amongst different shifts, machines cells, or even individual machines for a more drilled-down look at where problems may lie.
Common categories of downtime include excessive tool changeover, excessive job changeover, lack of operator, and unplanned machine maintenance.

Until factories are completely autonomous, there will always be downtime. Luckily, this is incorporated into expectations as “planned” downtime.
With machine monitoring, you can better understand what percentage of downtime is unplanned and see where the data reveals differences from expectations.
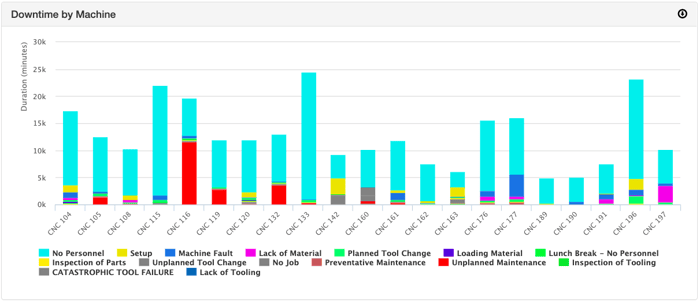
By drilling down to a more specific element, such as a certain job, machine, or shift, manufacturers can spot inefficiencies.
Does the nighttime shift experience far more downtime than the day shifts? Why?
Is there a particular machine experiencing more downtime than others? Is this creating a bottleneck?
Here are some additional questions to ask:
With the right machine monitoring partner and effective machine downtime monitoring, manufacturers can pursue continuous improvement initiatives knowing they have immediate access to accurate production data, allowing them to take actionable steps to reduce downtime.
Fastenal is an American industrial supplier that provides companies with fasteners, tools, and supplies. The company needed a solution capable of handling smaller quantities and monitoring any production changes between shifts. Three months after implementing MachineMetrics, Fastenal achieved the following without increasing labor.
Carolina Precision is a contract manufacturer that specializes in small-diameter, close-tolerance CNC Swiss turned parts. Using MachineMetrics the company was able to identify what was causing downtime and leveraged the Pareto charts to save $1.5 Million in the first year. “This was one of the first big lessons we learned about machine monitoring,” says Gary Bruner, President of Carolina Precision Manufacturing, “It is a tool for finding problems that we didn’t know we had; for finding and addressing the issues as they came up and not after they had happened.” Carolina Precision’s overall gained:
Wiscon Produces quality precision parts for aerospace, medical, energy, automotive, construction, power, and other industries. One of the companies main priorities was to identify the top causes of downtime. The company needed accurate data presented in a way that workers and managers could interact with more dynamically in real-time.
One of the biggest benefits since implementing the solution from MachineMetrics was simply knowing when the equipment was running and seeing when the production of a specific part was not lining up to standard. For example, if a part goal isn’t being reached, and the utilization is 99%, engineering knows it’s because of the cycle count time.
Using MachineMetrics, Wiscon increased the company's overall capacity by 30%, and operator efficiency by 48%. Additionally, the company was able to increase the average:
Most companies significantly underestimate their true downtime, and over 80% of companies are unable to calculate their true downtime costs correctly. Common categories of unplanned downtime include excessive tool changeover, excessive job changeover, lack of operator, and unplanned machine maintenance.
Downtime is the single largest source of lost production time. Whether you want basic information or deep dives, MachineMetrics develops tracking, analytics, user-friendly reporting, and interactive tools to track downtime and ensure everyone knows what is happening on the shop floor.
Book a demo with our team today to learn how MachineMetrics can help you get complete visibility into the shop floor or learn more about how MachineMetrics can help you start reducing downtime.
Ready to empower your shop floor?
Learn More

.png?width=1960&height=1300&name=01_comp_Downtime-%26-Quality_laptop%20(1).png)
Comments