
Book a Demo of MachineMetrics
The leading platform to collect, monitor, analyze, and drive action with machine data. Set up time with a product specialist to learn how we can help your operation.
Ready to empower your shop floor?
Learn More.svg)

Real-time data is critical to making fast decisions on the shop floor. It's one of the many reasons that the Current Shift Dashboard is one of MachineMetrics' most popular features.
However, what's also incredibly useful is an accurate record of historical information that can be referenced at any time. The ability to look deeply into past performance makes the MachineMetrics Timeline a critical feature for root cause analysis.
Machine timelines provide an interactive view for each machine showing operating status over time alongside diagnostic machine data. Further, you can quickly view whichever range of time makes sense for your current analysis.
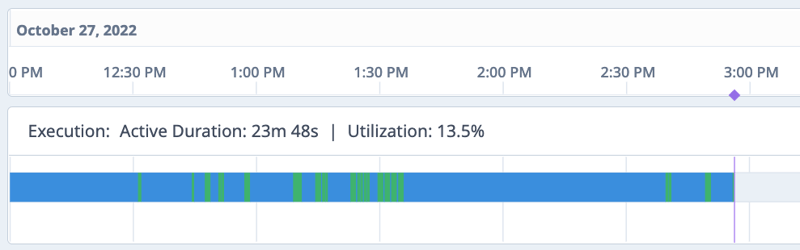
While dashboards and reports provide an overview of production, timelines drill deeper into the performance and health of equipment, enabling users to look back in time to see what happened to their machines and why, down to every minute.
In the below video, Director of Business Development Ben Groves walks through the MachineMetrics Timeline feature.
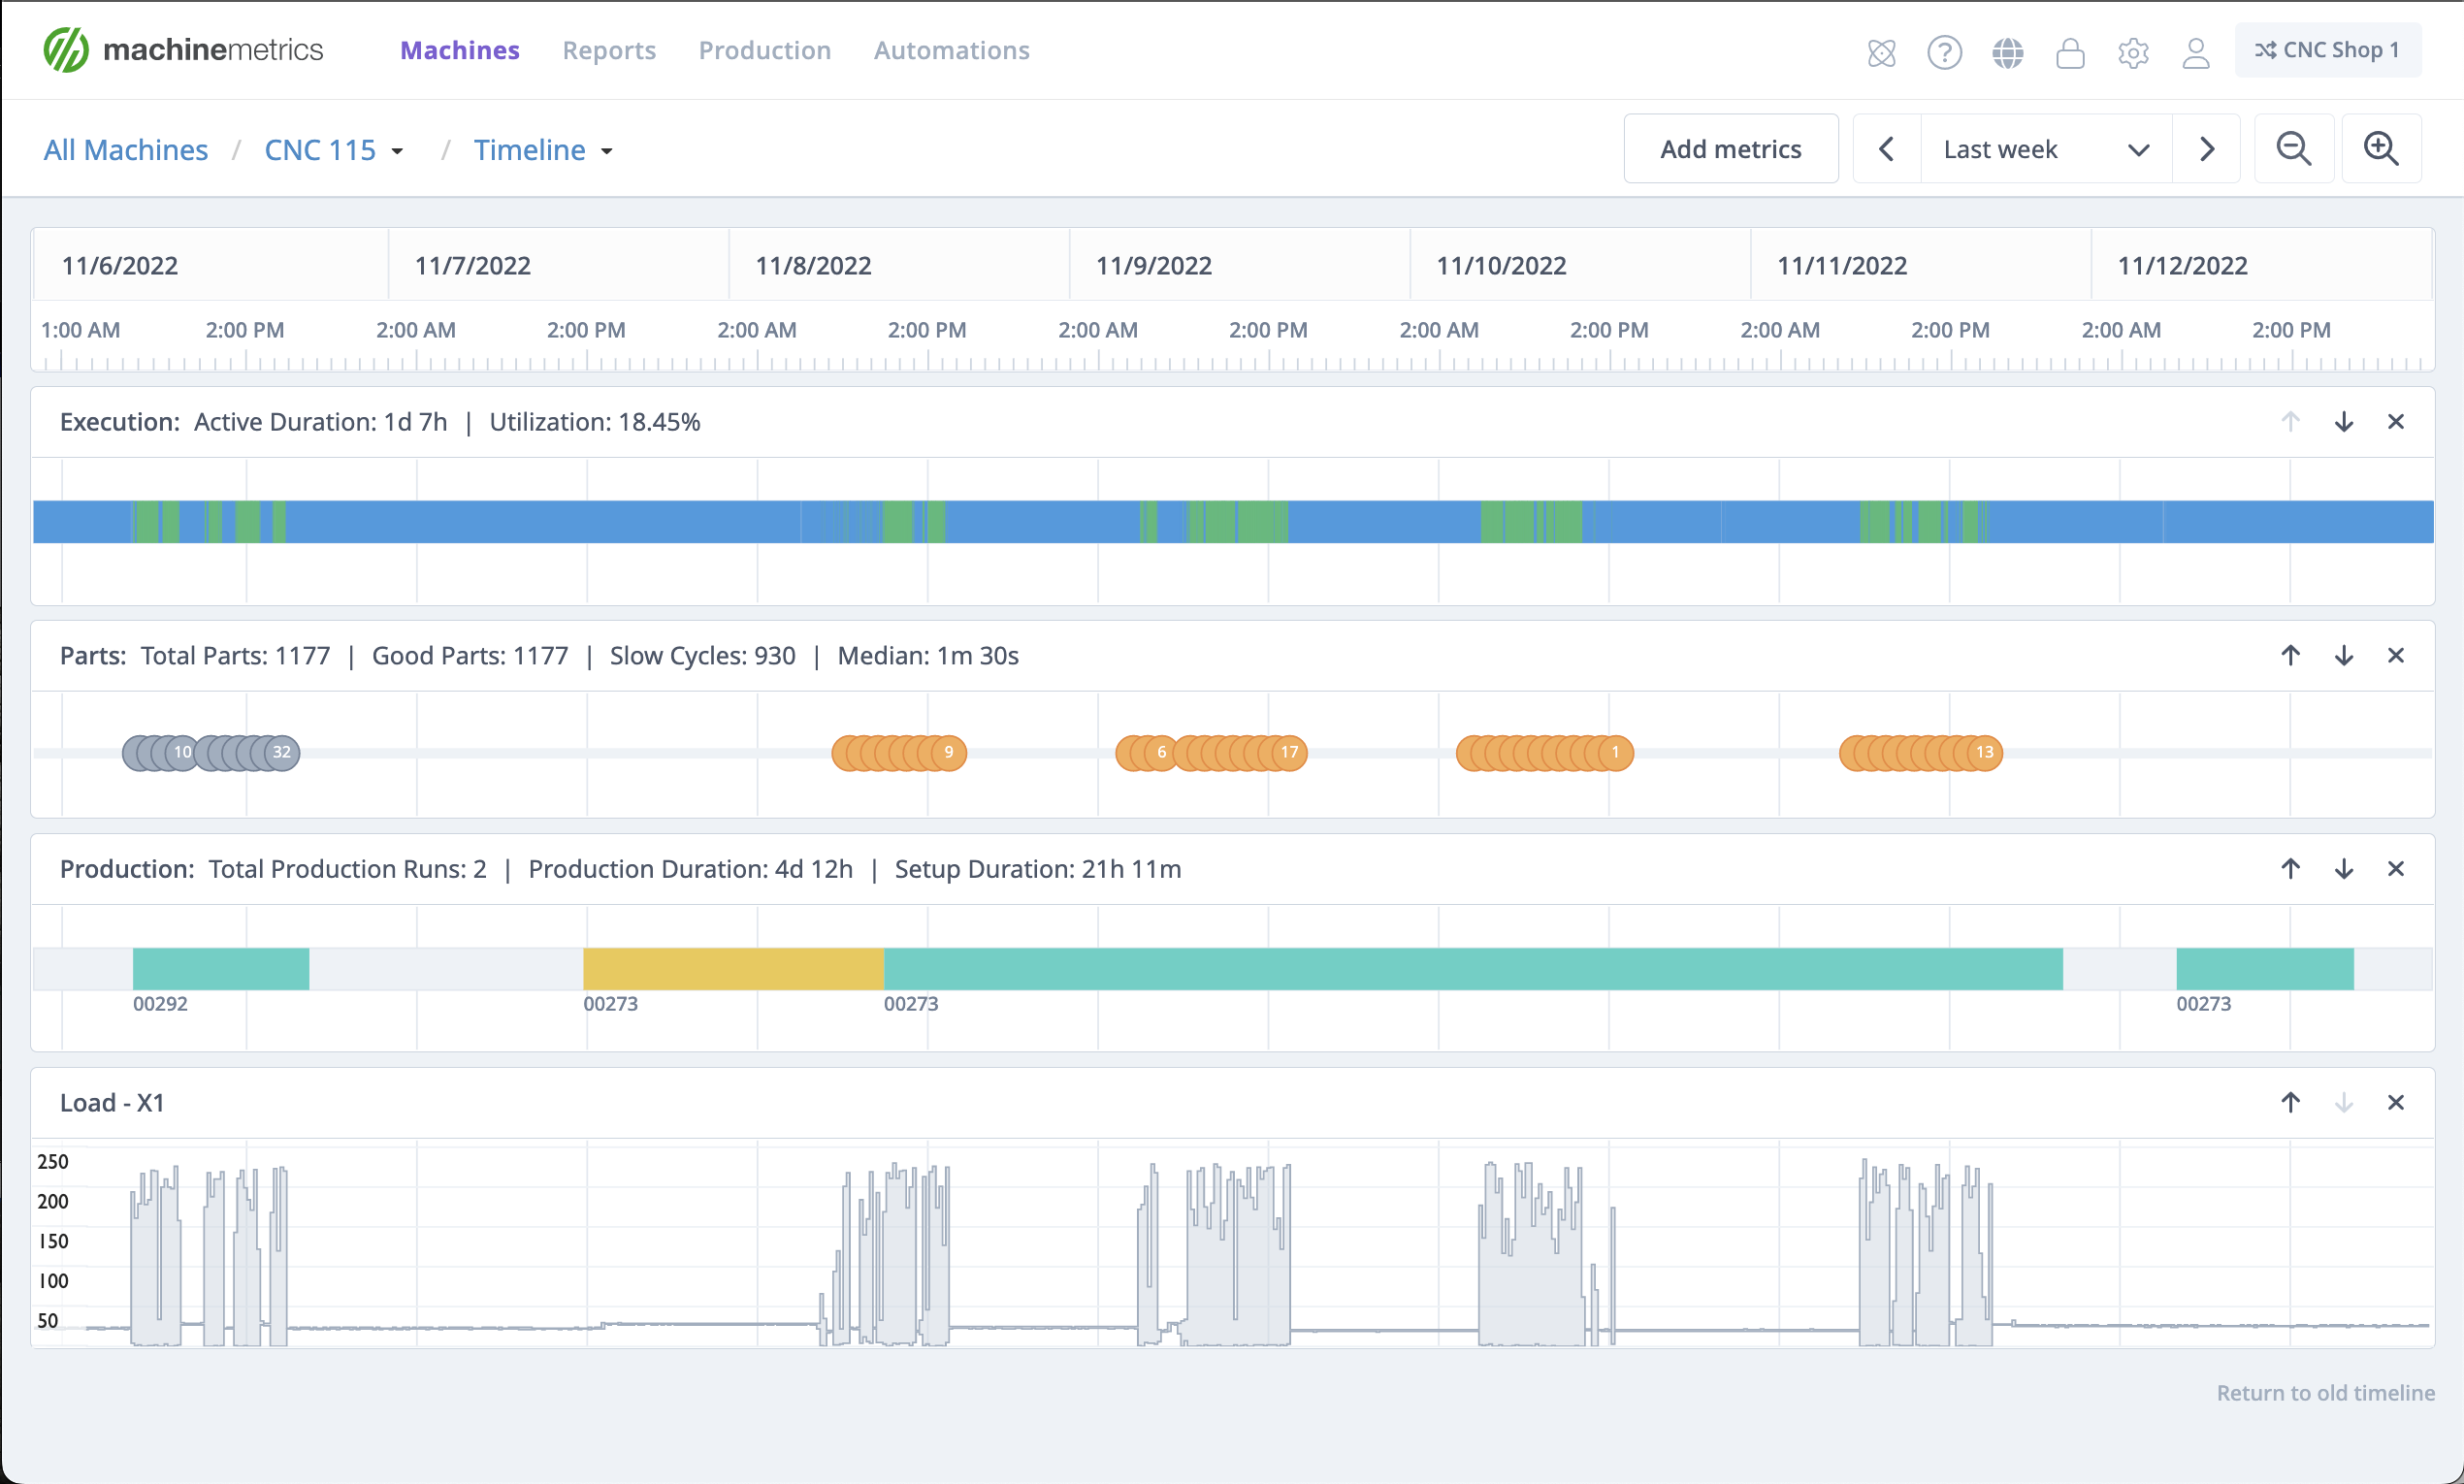
The MachineMetrics Timeline is quite helpful when looking for specific causes of problems, or to identify patterns in performance. By providing a detailed overview of machine operations, including running and idle times, production output, downtime categorization, and alarms, the Timeline enables quick identification of potential issues. This helps pinpoint the sequence of events leading to malfunctions or inefficiencies, making the diagnostic process both faster and more accurate.
The Timeline's ability to zoom into granular data, such as motor loads or tool change frequencies, further aids in distinguishing between symptoms and root causes. The integration of sensor data like temperature and vibration readings allows for a thorough analysis, correlating mechanical performance with external factors. This precise and detailed approach ensures quicker problem resolution, better preventive strategies, and improved machine productivity.
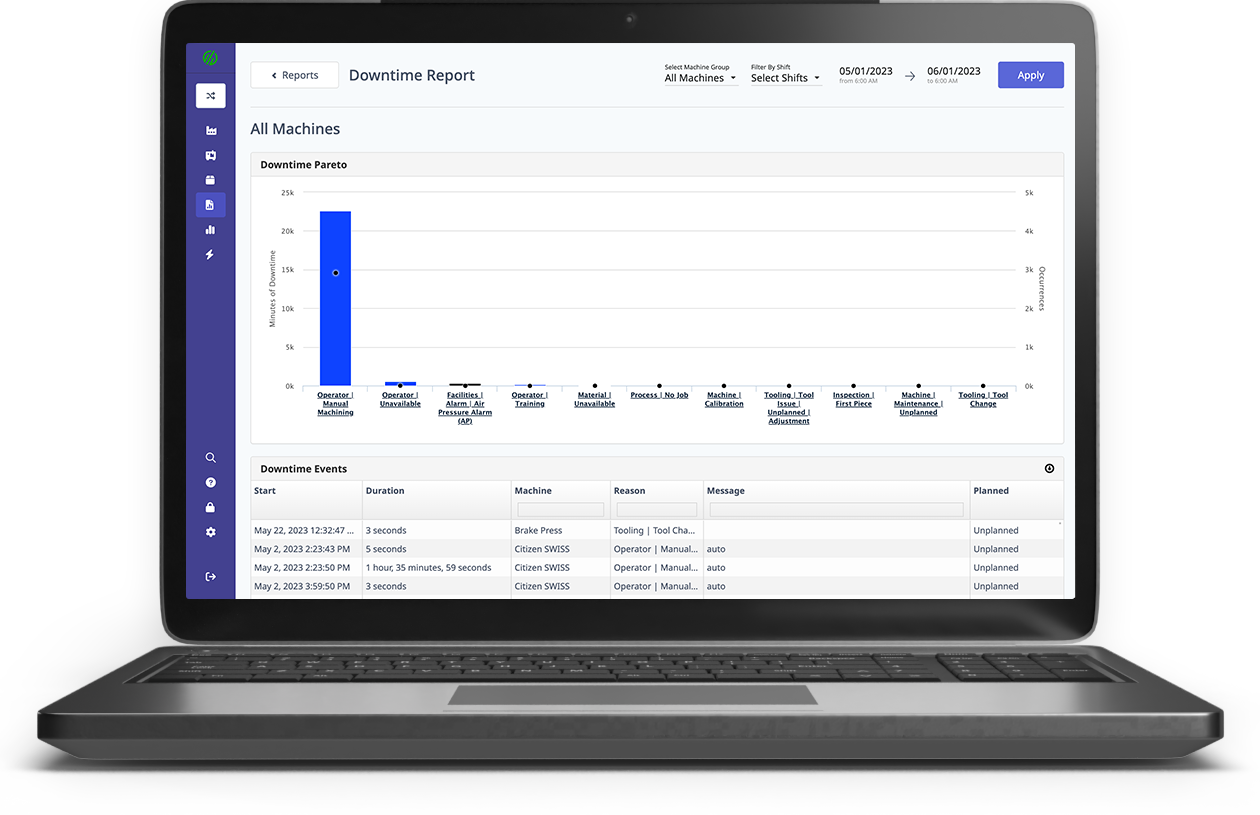
Not all MachineMetrics customers choose to categorize their downtime reasons. Those who do see immense value in understanding what the top causes of their downtime are, enabling them to adjust processes to reduce or eliminate causes of downtime.
While operators can categorize the reason for a downtime event, it is possible for the downtime reason to not be collected in real-time at the machine. In this case, users can leverage the machine timeline to document downtime reasons.
The Timeline puts power into the hands of engineers and managers searching for the “why” behind downtime events, extended cycle times, and any other issues occurring on the shop floor. With an accurate record of every machine event, you can find out exactly what occurred at any given time in the past. Think of it like a logbook for every single machine in your plant. Want an inside look? Watch our on-demand product tour:
Ready to empower your shop floor?
Learn More

.png?width=1960&height=1300&name=01_comp_Downtime-%26-Quality_laptop%20(1).png)


.gif)


Comments