Manufacturing Analytics Software: Drive Value With Real-Time Data
Get actionable, real-time insights into your production with MachineMetrics. Increase efficiency and profitability with complete accessibility to all your manufacturing data, anytime, anywhere.
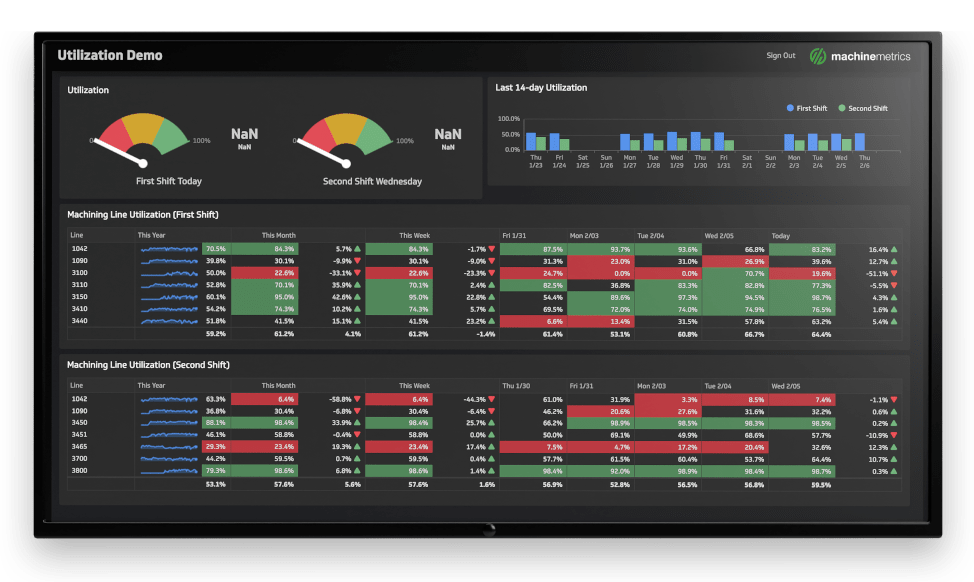
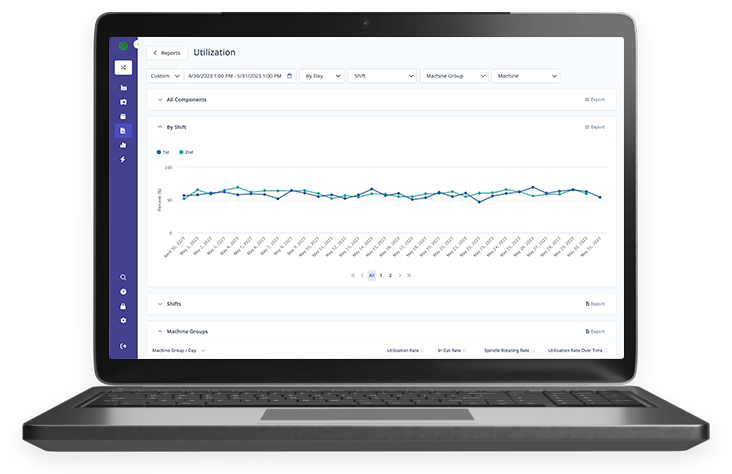
Leverage production dashboards on the shop floor for visibility and accountability, track your most important KPIs, and run in-depth reports on downtime, utilization, and OEE.
All in a plug-and-play system designed to help you make better, faster decisions and get to ROI fast.
What is Manufacturing Analytics Software?
Manufacturing analytics software is a business intelligence (BI) tool for capturing, aggregating, and analyzing manufacturing data analytics. Through the collection and manipulation of large quantities of data from sensors and other systems within a manufacturing business, manufacturing analytics reveal insights about processes and functions that can lead to improvements across all levels of an organization.
Using software to manage this process results in easy-to-understand insights that are actionable in real-time and centralized so that everyone can use them—from operators to managers to the CEO.
The results of using manufacturing analytics software are apparent in both the short and long term, with obvious boosts to customer satisfaction and reductions in errors and unplanned downtime. It provides immediate insight and control of the shop floor as well as long-game predictions to help manufacturers improve processes and stay agile even in a changing market.
Using everything from demand forecasting to machine utilization information, manufacturing analytics software serves to generate useful insights to guide business decisions in a data-driven, trustworthy, and impactful way.
The idea behind utilizing advanced manufacturing analytics software is to move from descriptive analytics into predictive analytics. This means that manufacturers can advance from using data to simply “keep track of things” and instead leveraging data for more granular insights that decision-makers can use to guide the future of the organization. For example, with predictive analytics, manufacturers are able to predict issues on the shop floor before they happen, resulting in improved output and cost-savings.
How a Manufacturing Analytics Solution Works
Phase 1: Data Collection
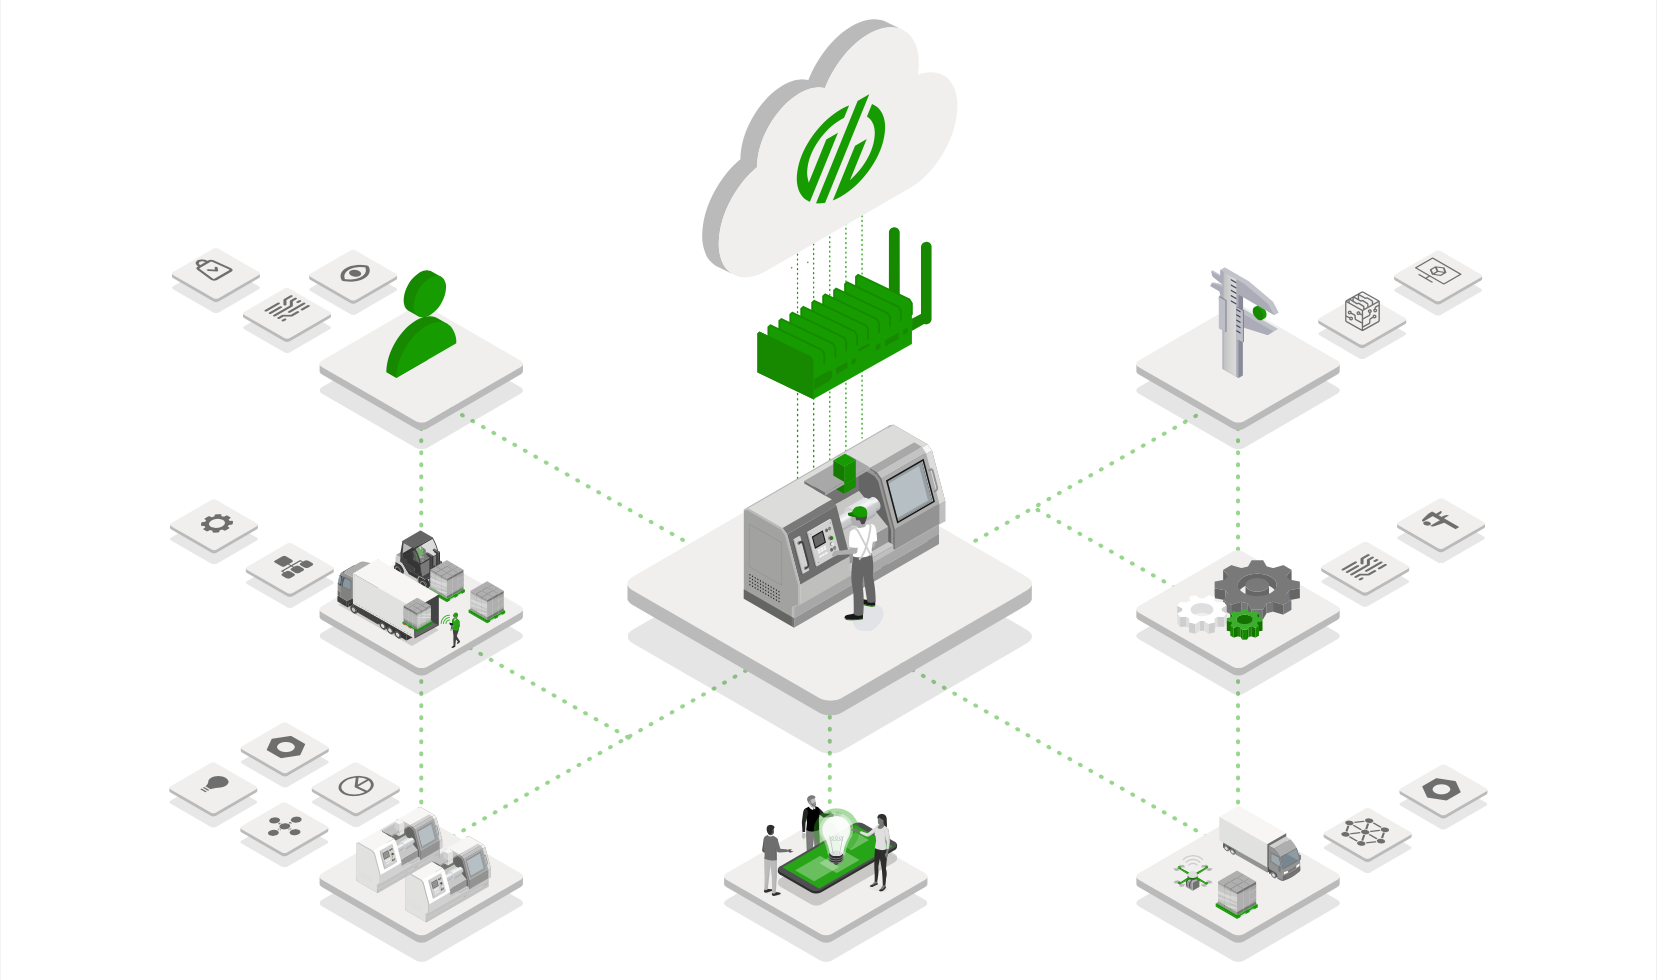
During this phase, manufacturers collect and aggregate data from a variety of sources throughout the organization. Manufacturers commonly collect data from:
- Machine Tools: A well of valuable data, machine tools provide information about statuses, modes, alarms, overrides, loads, speeds, and feeds. This data can be readily collected via ethernet using MachineMetrics solutions
- Connected Systems: Using APIs, connected systems such as ERP, CAM, and tooling and maintenance systems can be used to fill information gaps and provide context to machine data.
- Operators: Humans fill in remaining gaps that can’t be captured using the previous two data collection methods. This can include adding context to test runs that occur after maintenance (which may otherwise appear as short production runs which can skew insights) as well as information like why a machine is idle without an alarm.
- Sensors: Sensor data can be gathered from practically anywhere in a facility. When attached to machines, they may measure vibration, power draw, or temperature. In other locations in the shop, they could measure temperature, noise levels, light levels, air quality, humidity, and more. Sensors are considered a relatively cheap and easy method to gather a vast and varied array of data in manufacturing environments.
Phase 2: Transform And Standardize Data
All data sources are not created equal, and the information collected using discrete methods is not a plug-and-play step toward generating insights. First, data has to be transformed into formats that can work together and standardized so that like is compared with like when the data is analyzed.
For example, you want to use and compare time and duration data with other time and duration data—if that data “column” also has data about the number of scrap parts generated in a production run or the humidity levels on the shop floor, then your “time” insights would be flawed from the start. Instead, standardizing data puts like data in the same “column” and in the same format, e.g. one hour recorded as 00:01:00 instead of 01:00:00 since mixing the two formats would result in wildly inaccurate predictions.
Phase 3: Data Visibility & Accessibility for Decision-Making
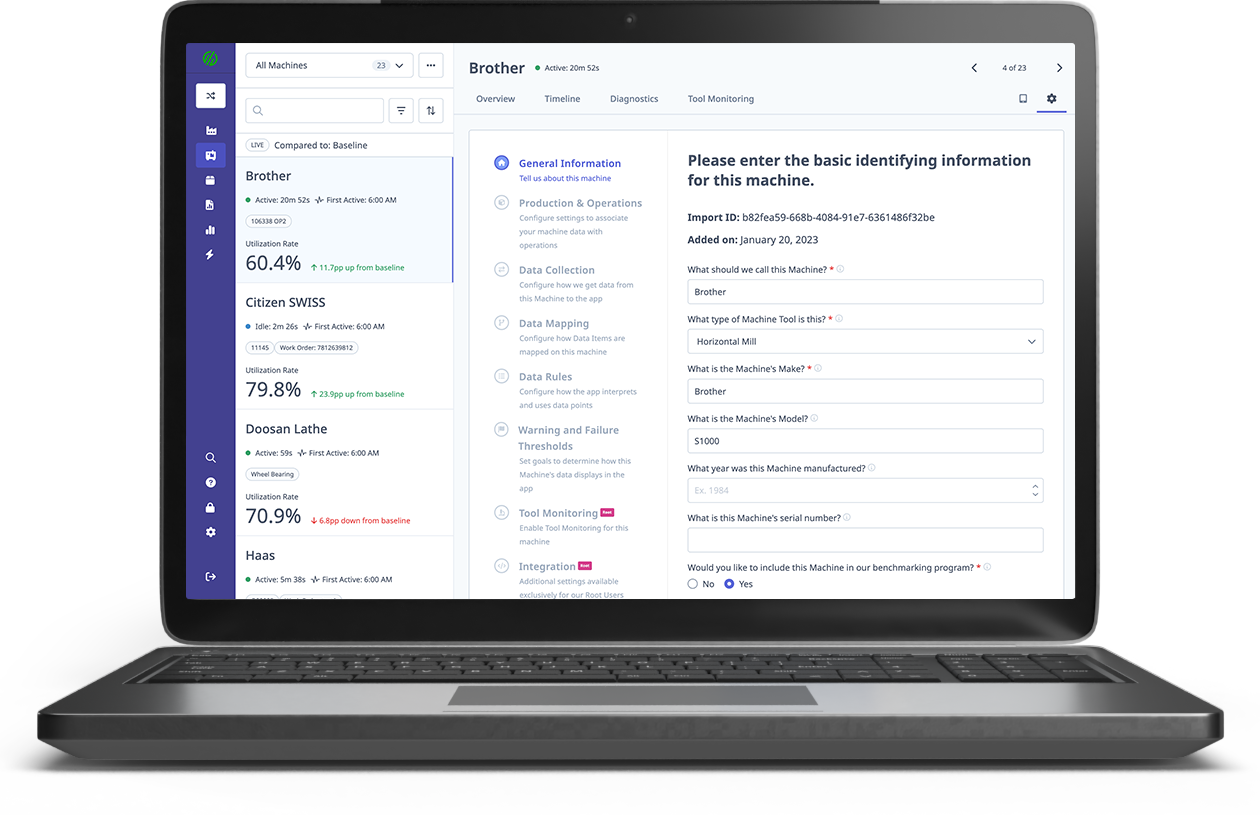
During this phase data becomes readable and accessible to workers throughout the manufacturing facility. It may be transformed into visual representations such as charts and graphs and become visible in a centralized way and/or pushed to relevant systems throughout the organization. In any case, the goal at this stage is to take raw insights and make them usable and actionable. Some ways manufacturers commonly make data visible and accessible for decision-making are:
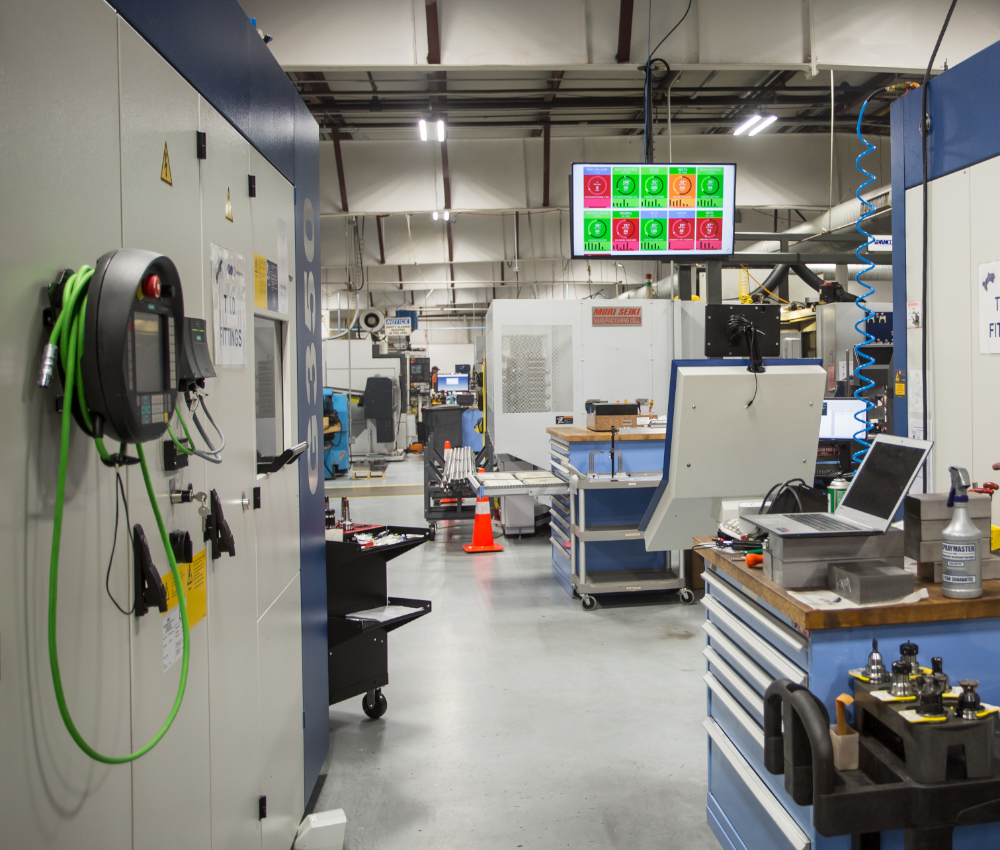
- Shop floor dashboards that can guide floor workers on their progress and status in relation to production goals
- Tablets with part counts at all machines
- Remote visibility into operations via centralization that allows decision-makers to access insights from anywhere.
- Deeper analysis via reports
Benefits and Use Cases: Getting Value from Your Data
|
Data is a proven method for manufacturers to better understand and improve their KPIs, accurately gauge performance, track progress, gain visibility into the shop floor, and develop automated processes. BenchmarkingNow that the operation has accurate data, how well are you actually performing? Data can reveal surprising insights about what functions best within a manufacturing facility as well as what bottlenecks exist. The same is applicable to production costs, downtime, and a host of other KPIs. Baselining and benchmarking give manufacturers an accurate foundation from which they can build and improve every aspect of their organization. Using baselining techniques, teams are able to clearly define improvements as well as accurately calculate ROI of any changes. VisibilityShop floor visibility is key for both managers as well as operators, allowing them to react quickly based on accurate, real-time data. Data that provides insights into what is happening on the shop floor either with the machinery, products, operators, or environment can help keep production goals on track, environments healthy and safe, and workers informed and satisfied—all the while reducing costs and downtime and maintaining or improving quality. Improvement in KPIsData offers insights into what matters most in a manufacturing organization as well as which improvements can make the most impact, so decision-makers can better prioritize high-impact, high-success actions. Data helps manufacturers identify and resolve bottlenecks, reduce downtime, and increase OEE. AutomationWith accurate, real-time data, you can begin to automate activities on the shop floor. Automated workflows that are relatively easy-to-implement that can generate massive value for manufacturers include:
|
Why MachineMetrics?
MachineMetrics is different from other manufacturing analytics software solutions. There are a variety of benefits our customers realize:
Features: How to Select An Analytics Solution
Simple Machine Integration
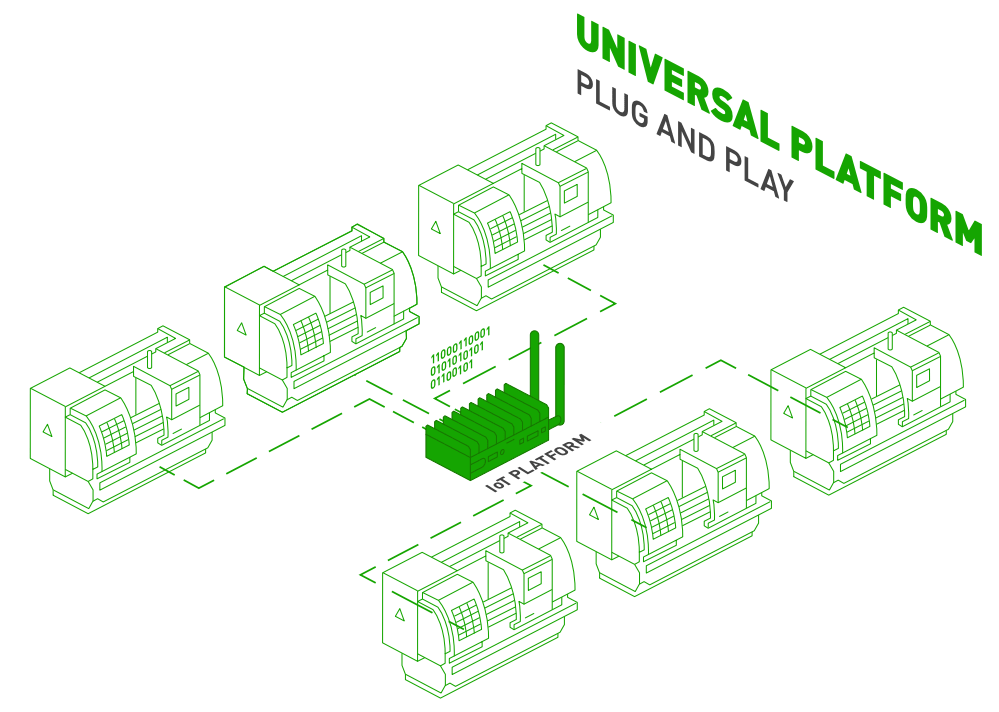
Plug-and-Play universal machine connectivity and data collection from PLC's supporting protocols including: MTConnect, Fanuc, OPC-UA, UMATI, Mitsubishi, Citizen, Haas, Heidenhain, Siemens Sinumerik, Modbus, and Ethernet IP. MachineMetrics Edge supports digital and analog I/O for machines without a standard connectivity option to integrate even the most challenging equipment.
Machine Downtime Tracking
Do you know immediately why your machines aren’t running? Solve machine downtime and utilization problems using the power of data.
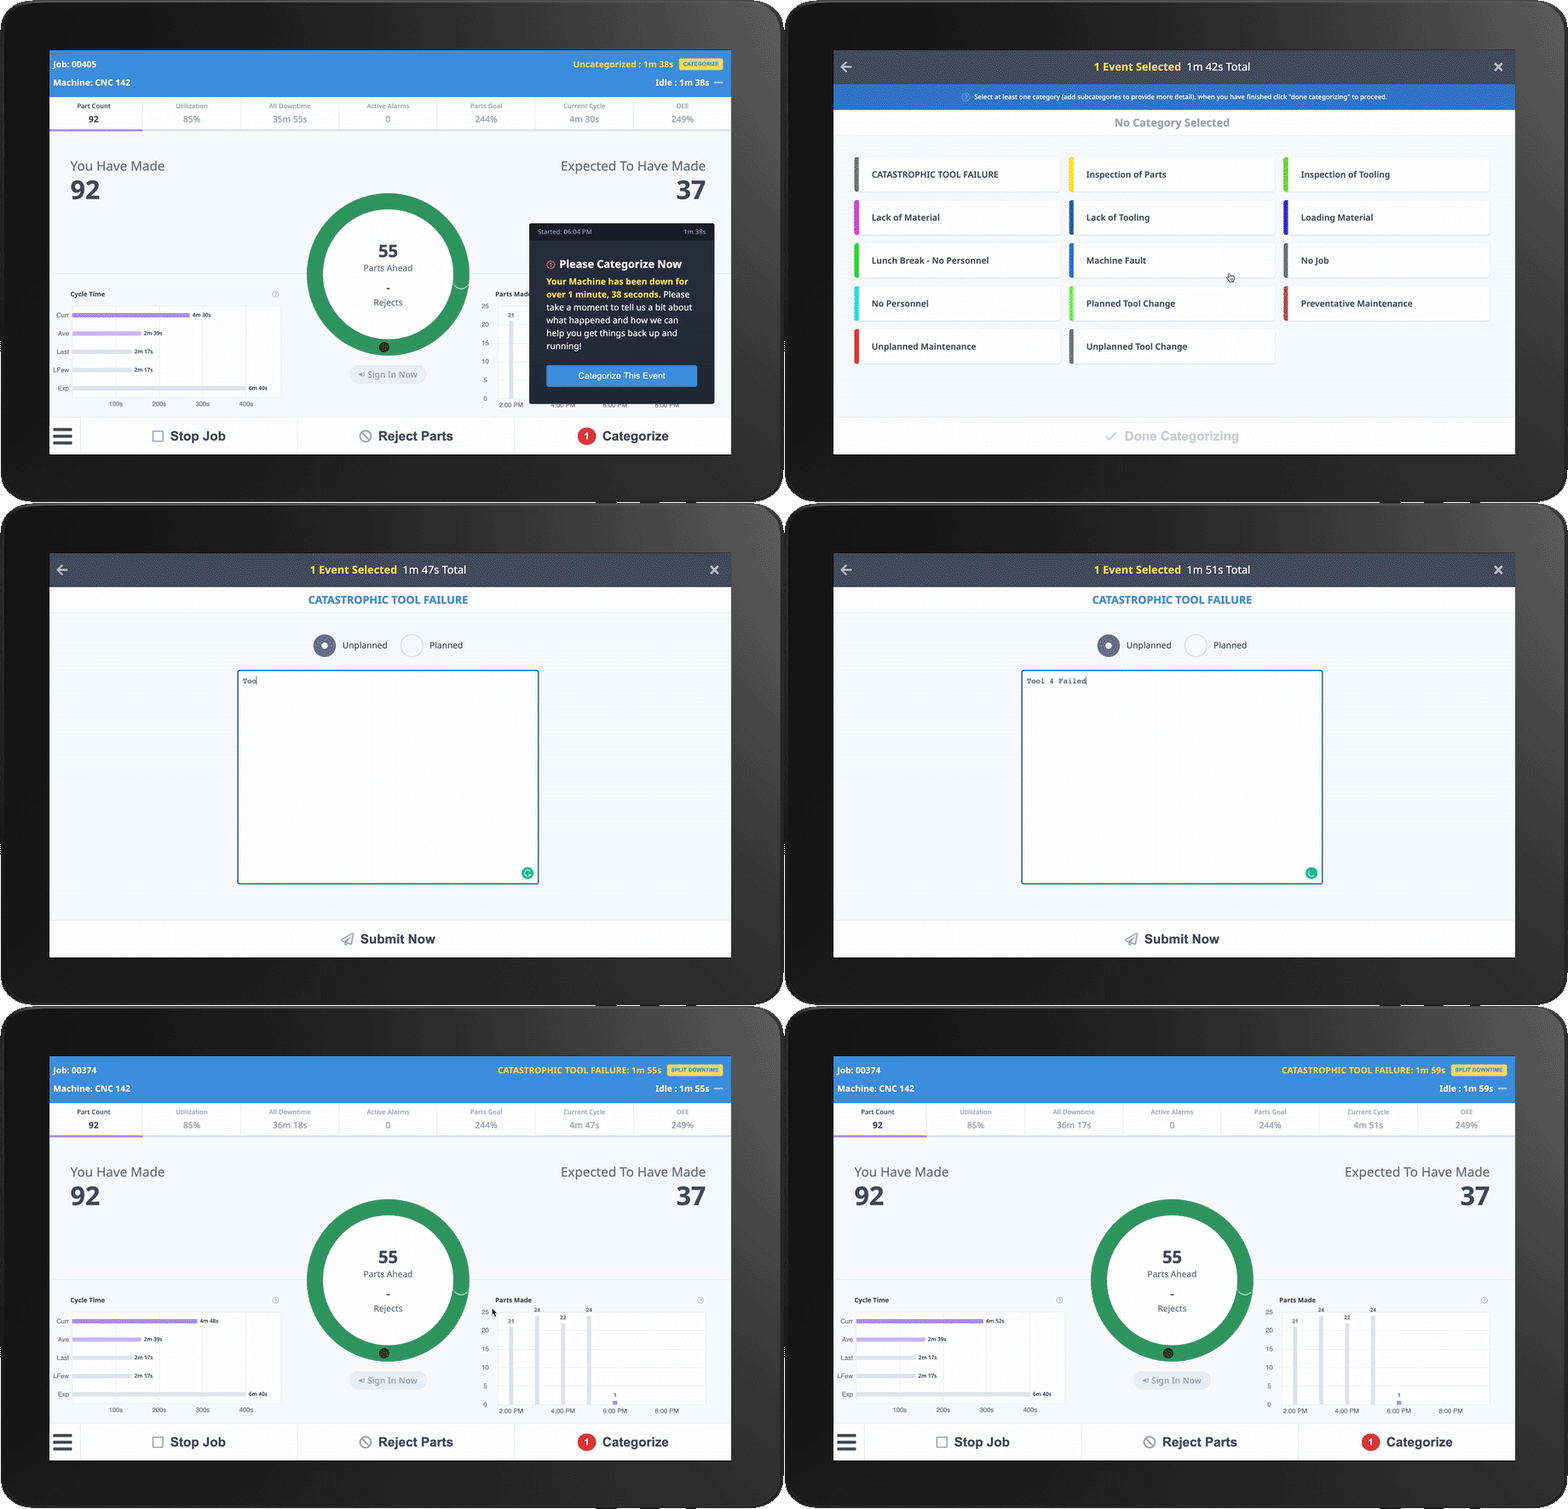
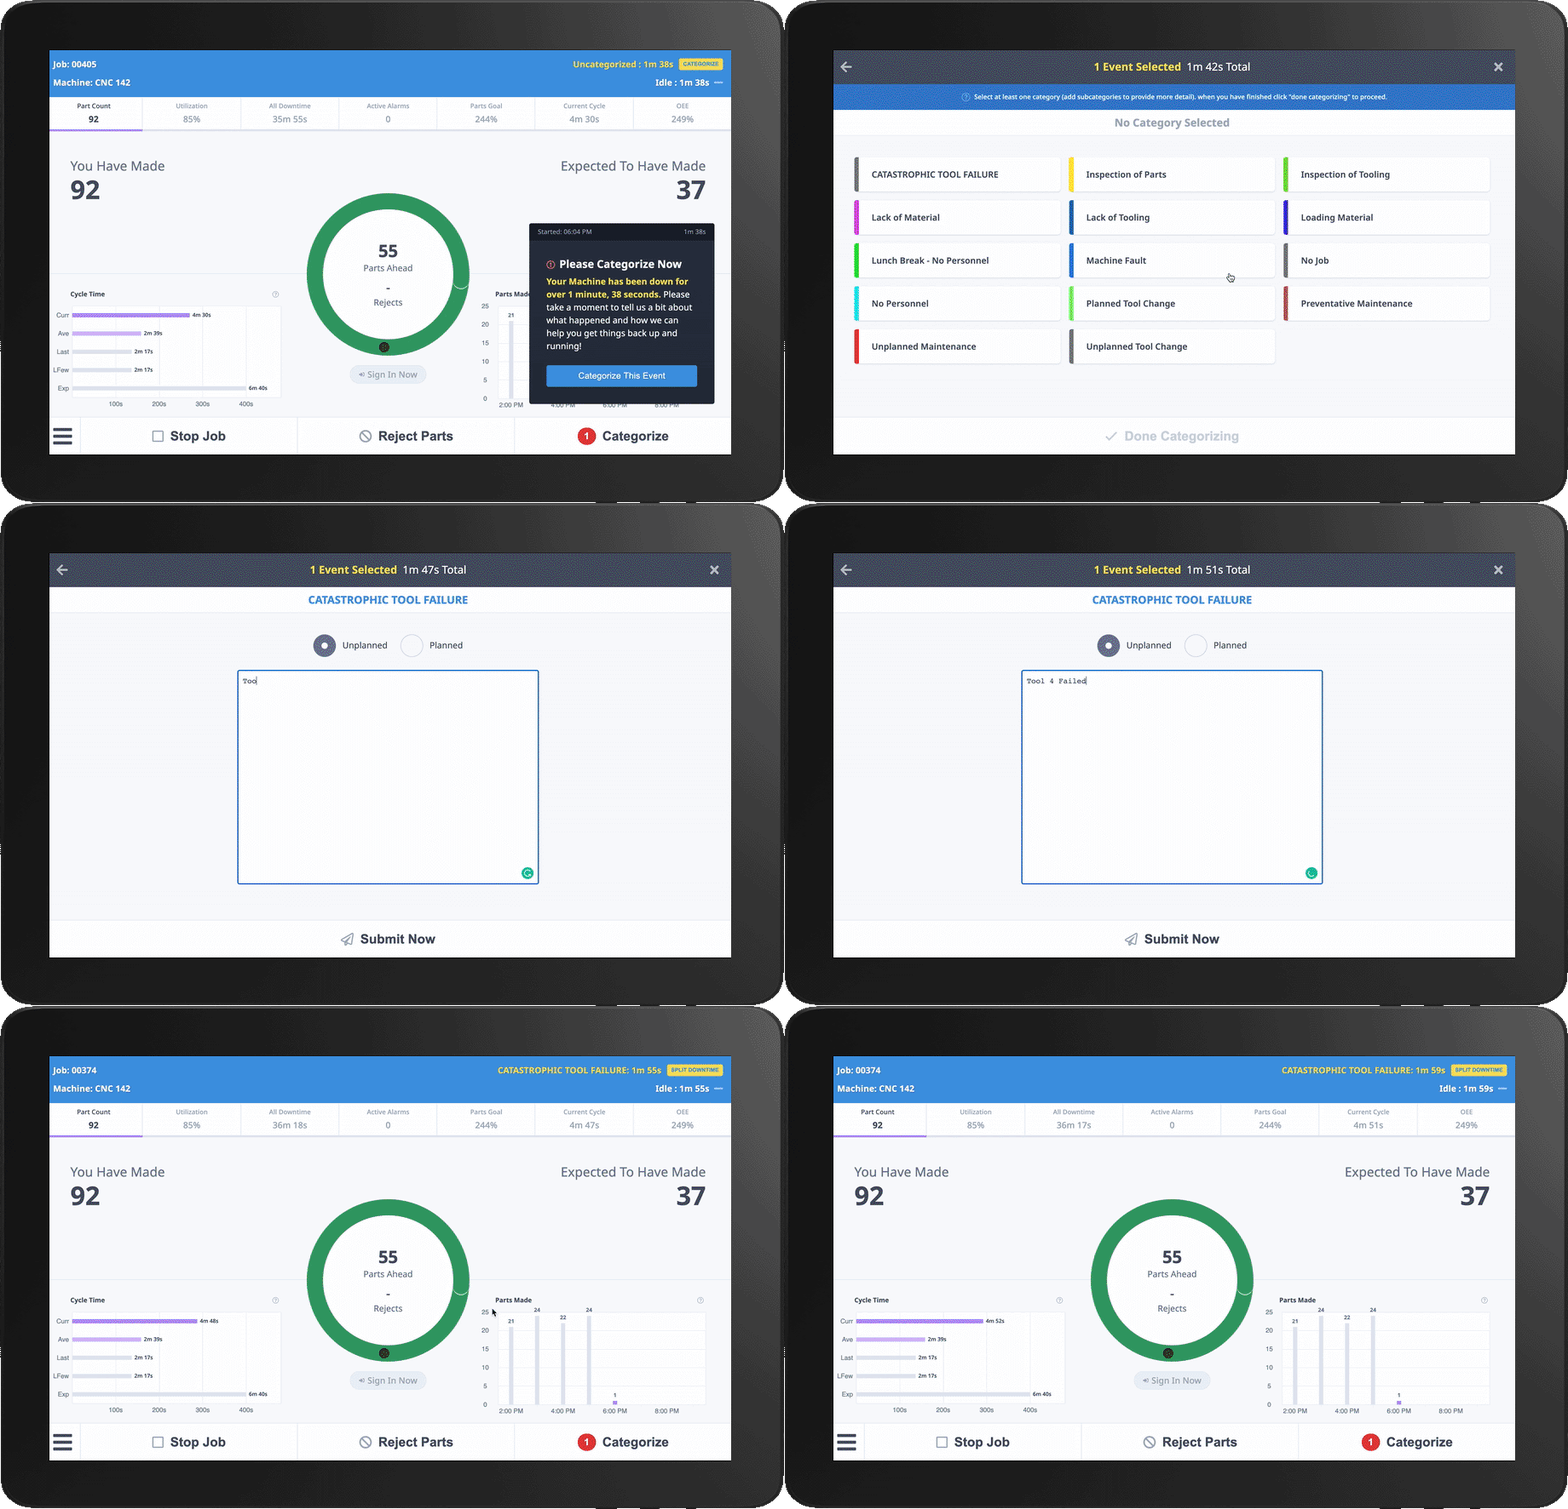
Each machine is equipped with a touchscreen with an intuitive interface that asks the operator to categorize downtime as it's happening. This information is made available to managers in real-time using downtime Pareto charts.
Automate tracking and categorization of common events such as tool changeovers and part changeovers using the MachineMetrics rules engine, saving you even more time.
Track Your Most Important Metrics and Activities
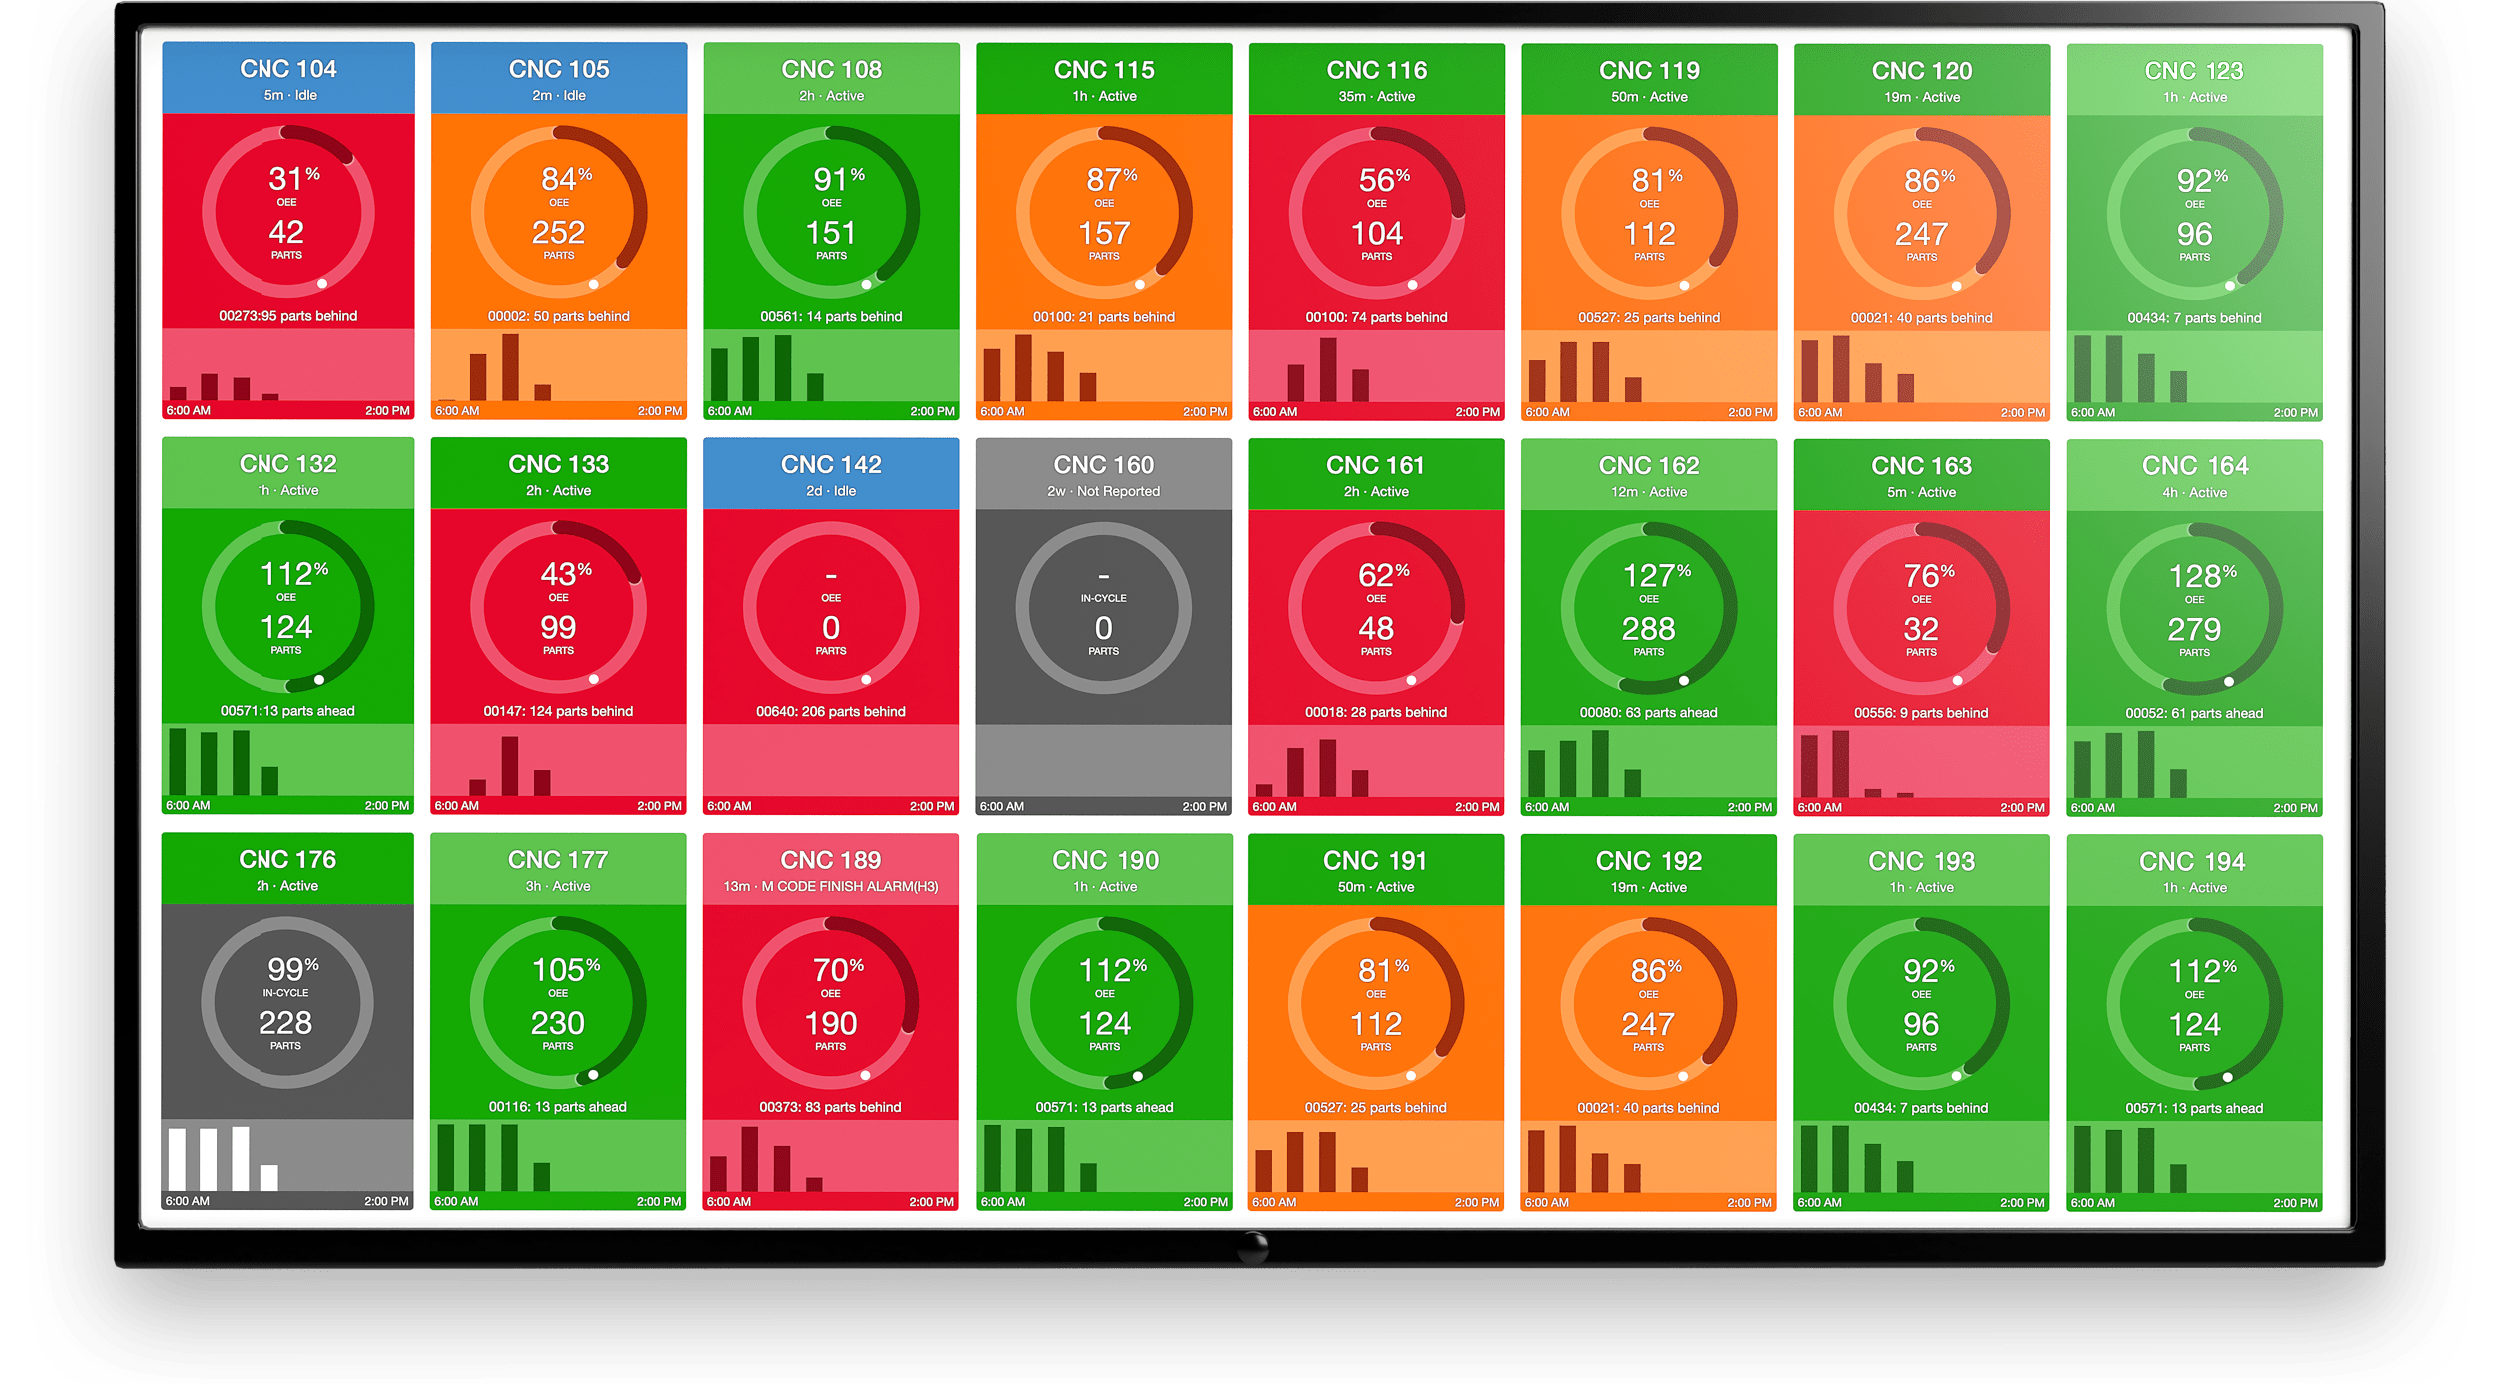
Optimize all of your processes using advanced data analytics that offer insights into all of the metrics that manufacturers value most. With MachineMetrics, you will have real-time data as well as access to historical data on OEE, quality, machine utilization, as well as job setup and changeover tracking. Accurate, real time analytics will give your team the information to make better decisions faster than ever before. Or dive deep with an in-depth analysis of custom reports, pareto charts, and visualizations that include your businesses most essential metrics.
Detailed Analytics
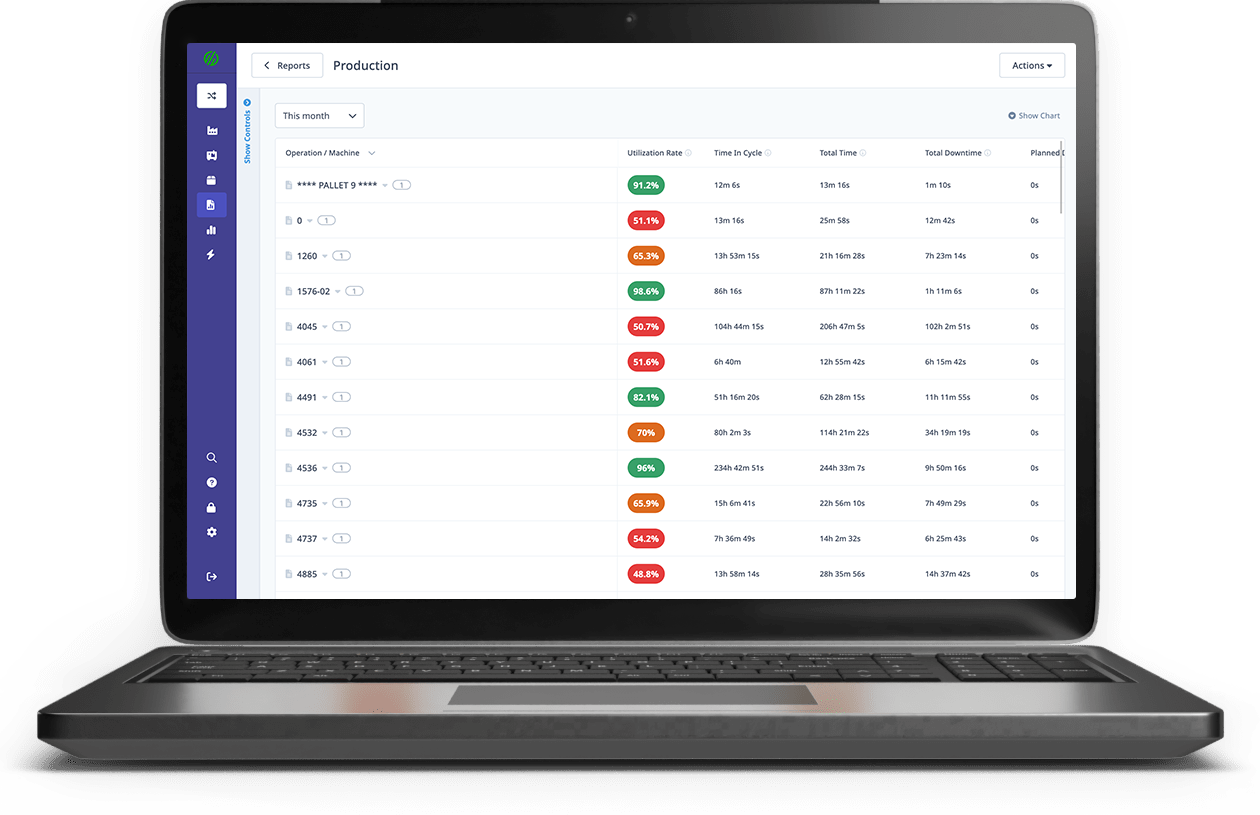
MachineMetrics is your machine data historian, giving you the ability to export all of a machine's event history for any period of time. This timeline option is useful for analyzing what happened and when on your machine including data on status, faults, programs, part cycles, and job. View the status over time of all your machines for a single day, or drill down into a single machine for a very detailed view. The cycles report provides statistical analysis on part cycles—often uncovering part cycle times that were potentially underestimated.
We also offer detailed reporting and analytics of your machining operations. Information such as cycle times, performance, number of parts produced, rejects, downtime reasons, and reject reasons can be reported for each part operation. This info allows managers to quickly identify issues that are related to a specific machining operation and help measure the effect of process improvements. Multi-pallet machines are supported because MachineMetrics uses the program name to determine what operation and part number is being machined, eliminating the need for operator input.
Request A Demo
Book a tailored demonstration of MachineMetrics that aligns with your specific manufacturing needs.
Book A Demo Now