
Book a Demo of MachineMetrics
The leading platform to collect, monitor, analyze, and drive action with machine data. Set up time with a product specialist to learn how we can help your operation.
MachineMetrics production monitoring software monitors OEE, machine utilization, and downtime for maximum production efficiency and deep operational insights. No manual data entry required.
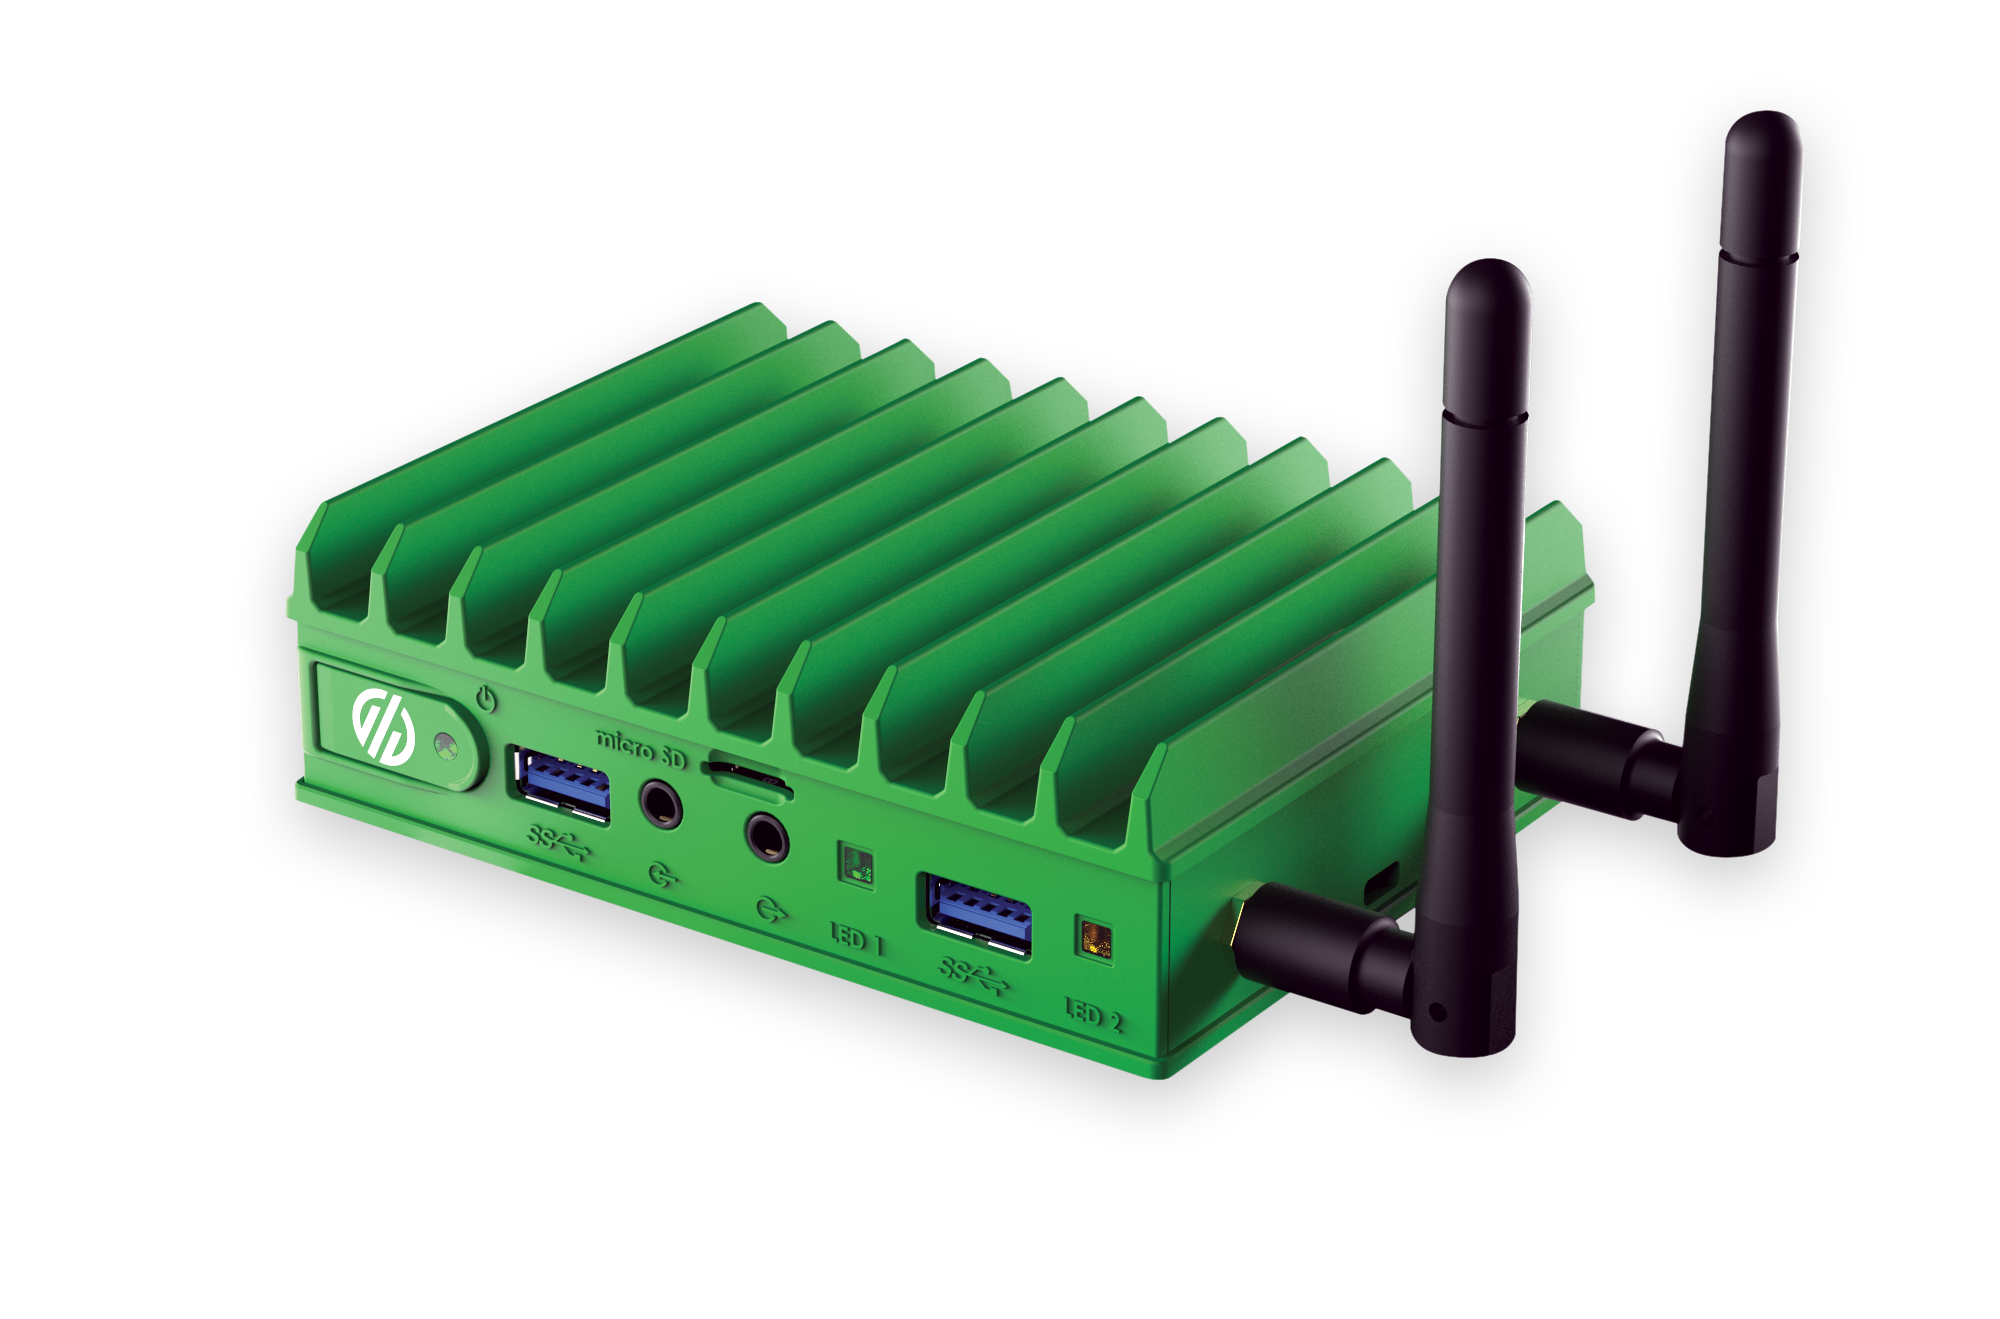
Collect data from to any machine by connecting the MachineMetrics Edge to the ethernet port of the control. Software on the edge processes data from the machine in real-time and streams the data securely to the MachineMetrics cloud.
View and manage the status of your machine assets from anywhere. Easily scale across all equipment, both modern and legacy assets.
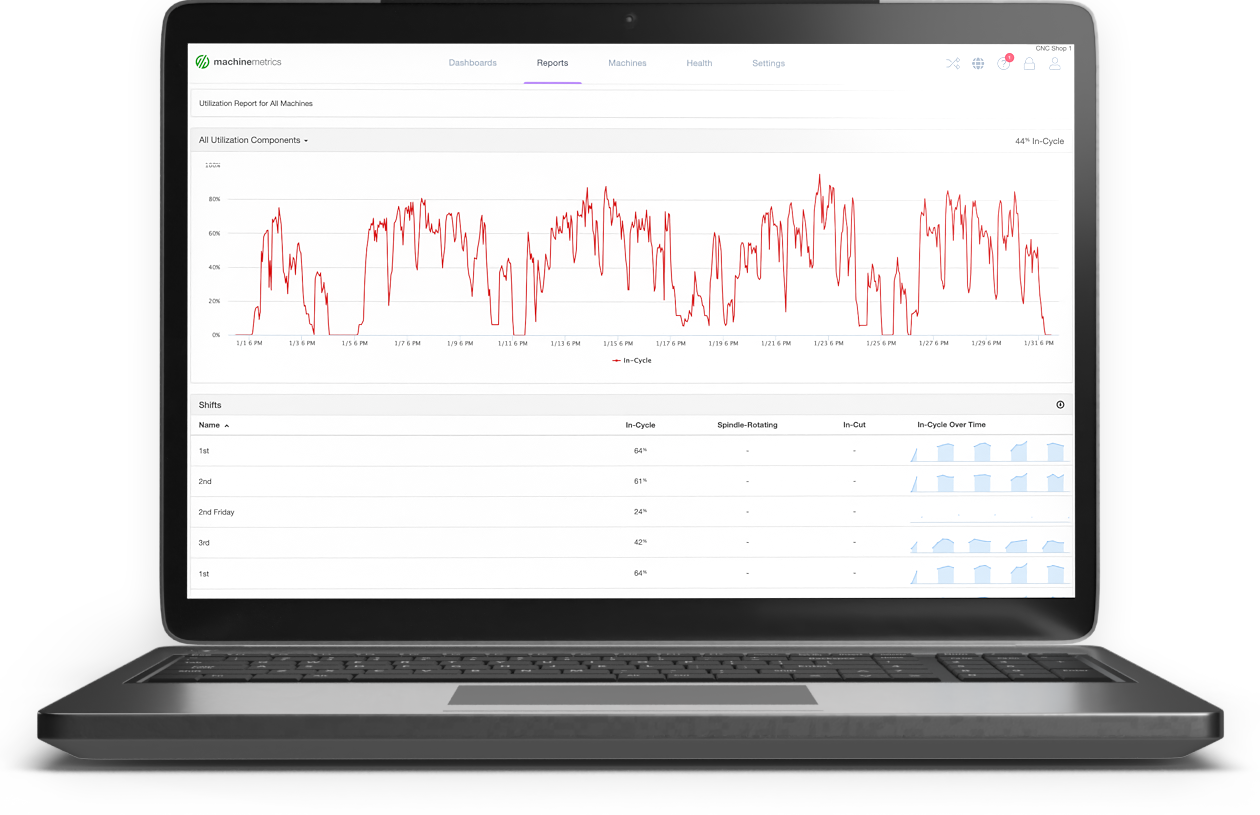
Visualize machine utilization by hour, shift, day, week, and month to analyze trends and uncover hidden capacity across the shop floor.
Drive a condition-based maintenance program using real-time machine diagnostics. Push the data into a CMMS to automatically create work orders.
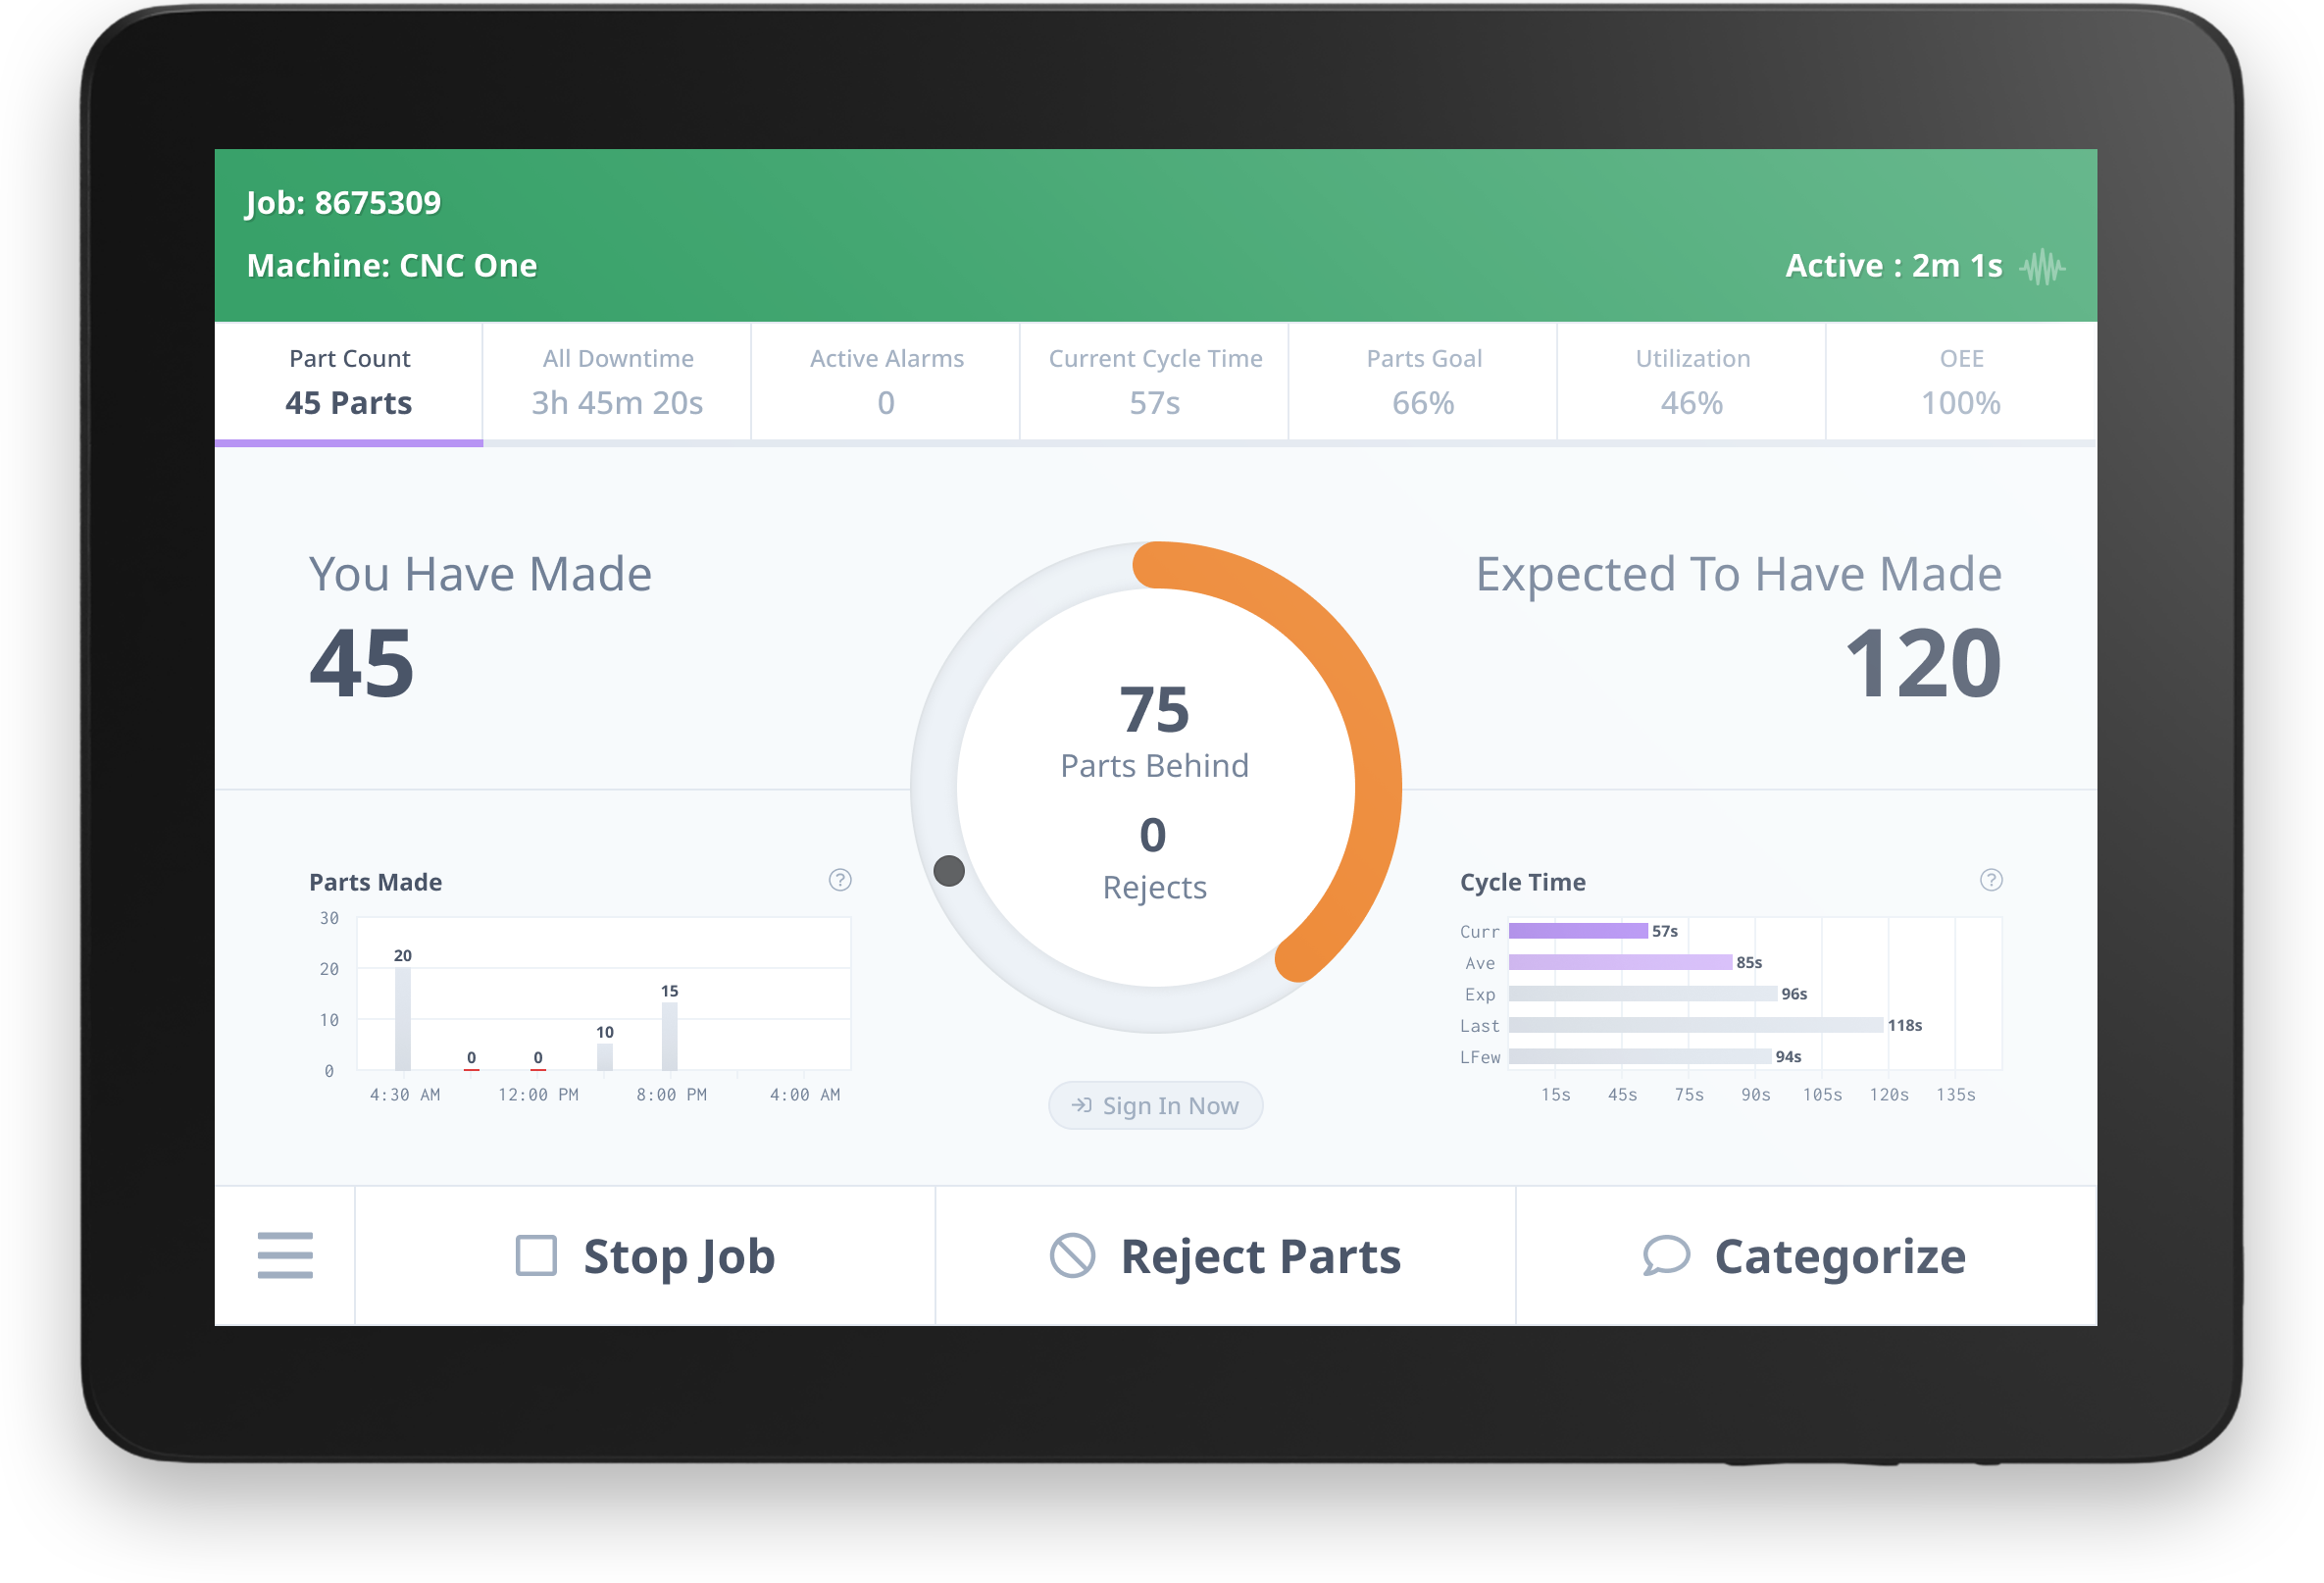
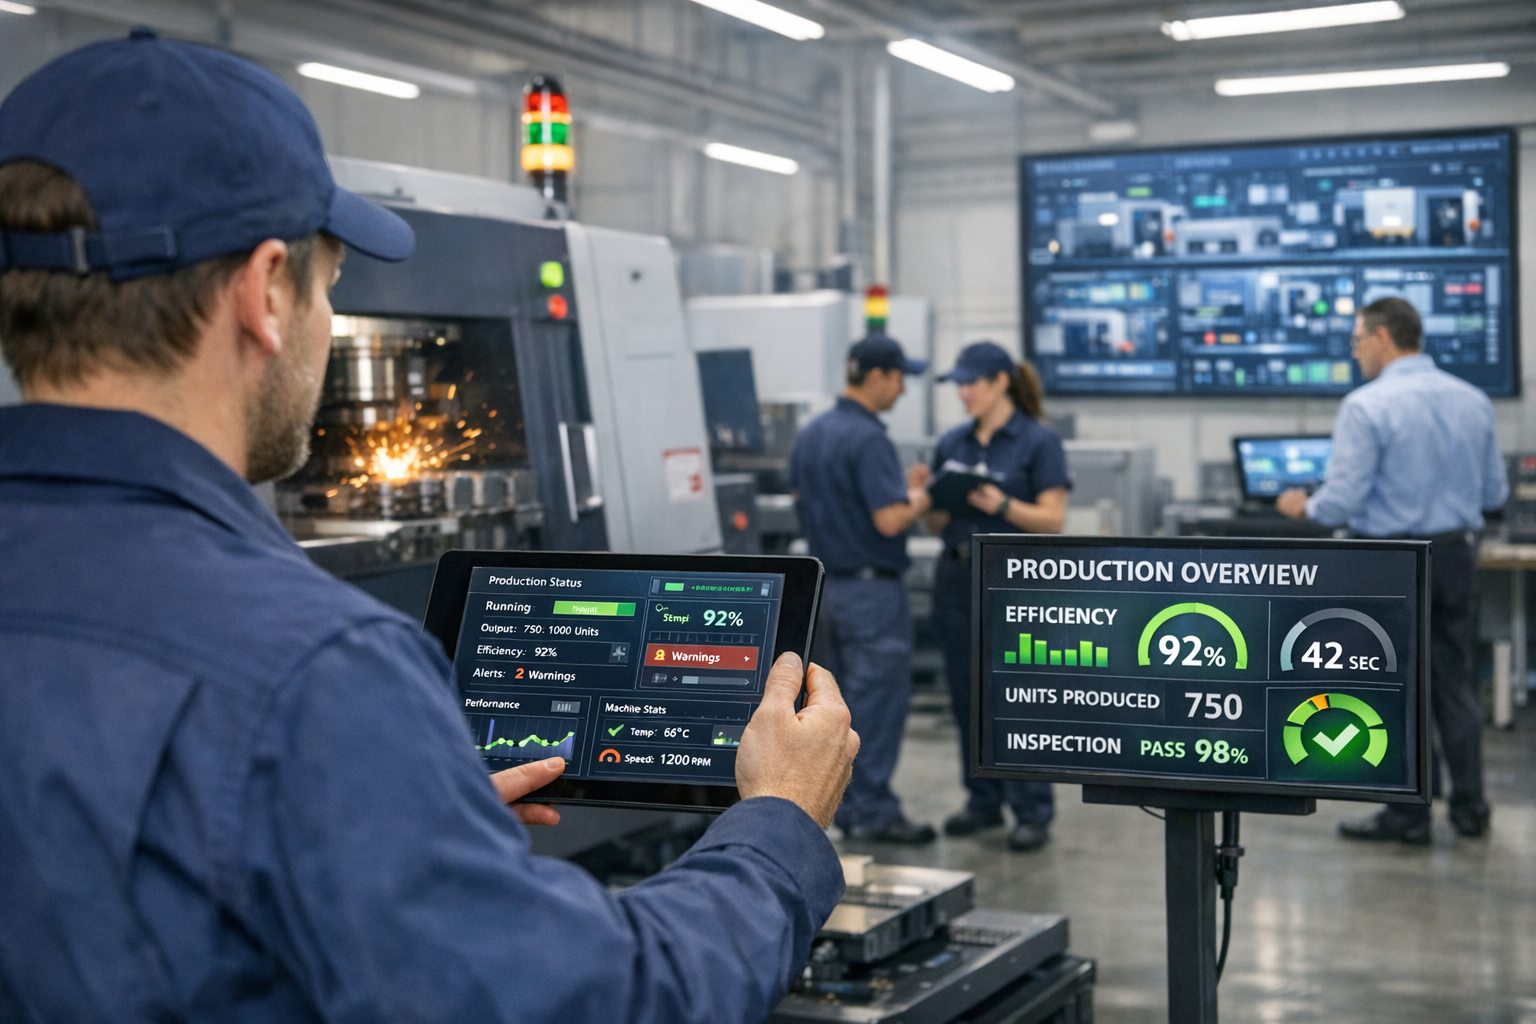
Empower operators to meet production goals by visualizing performance and identifying production issues in real-time.
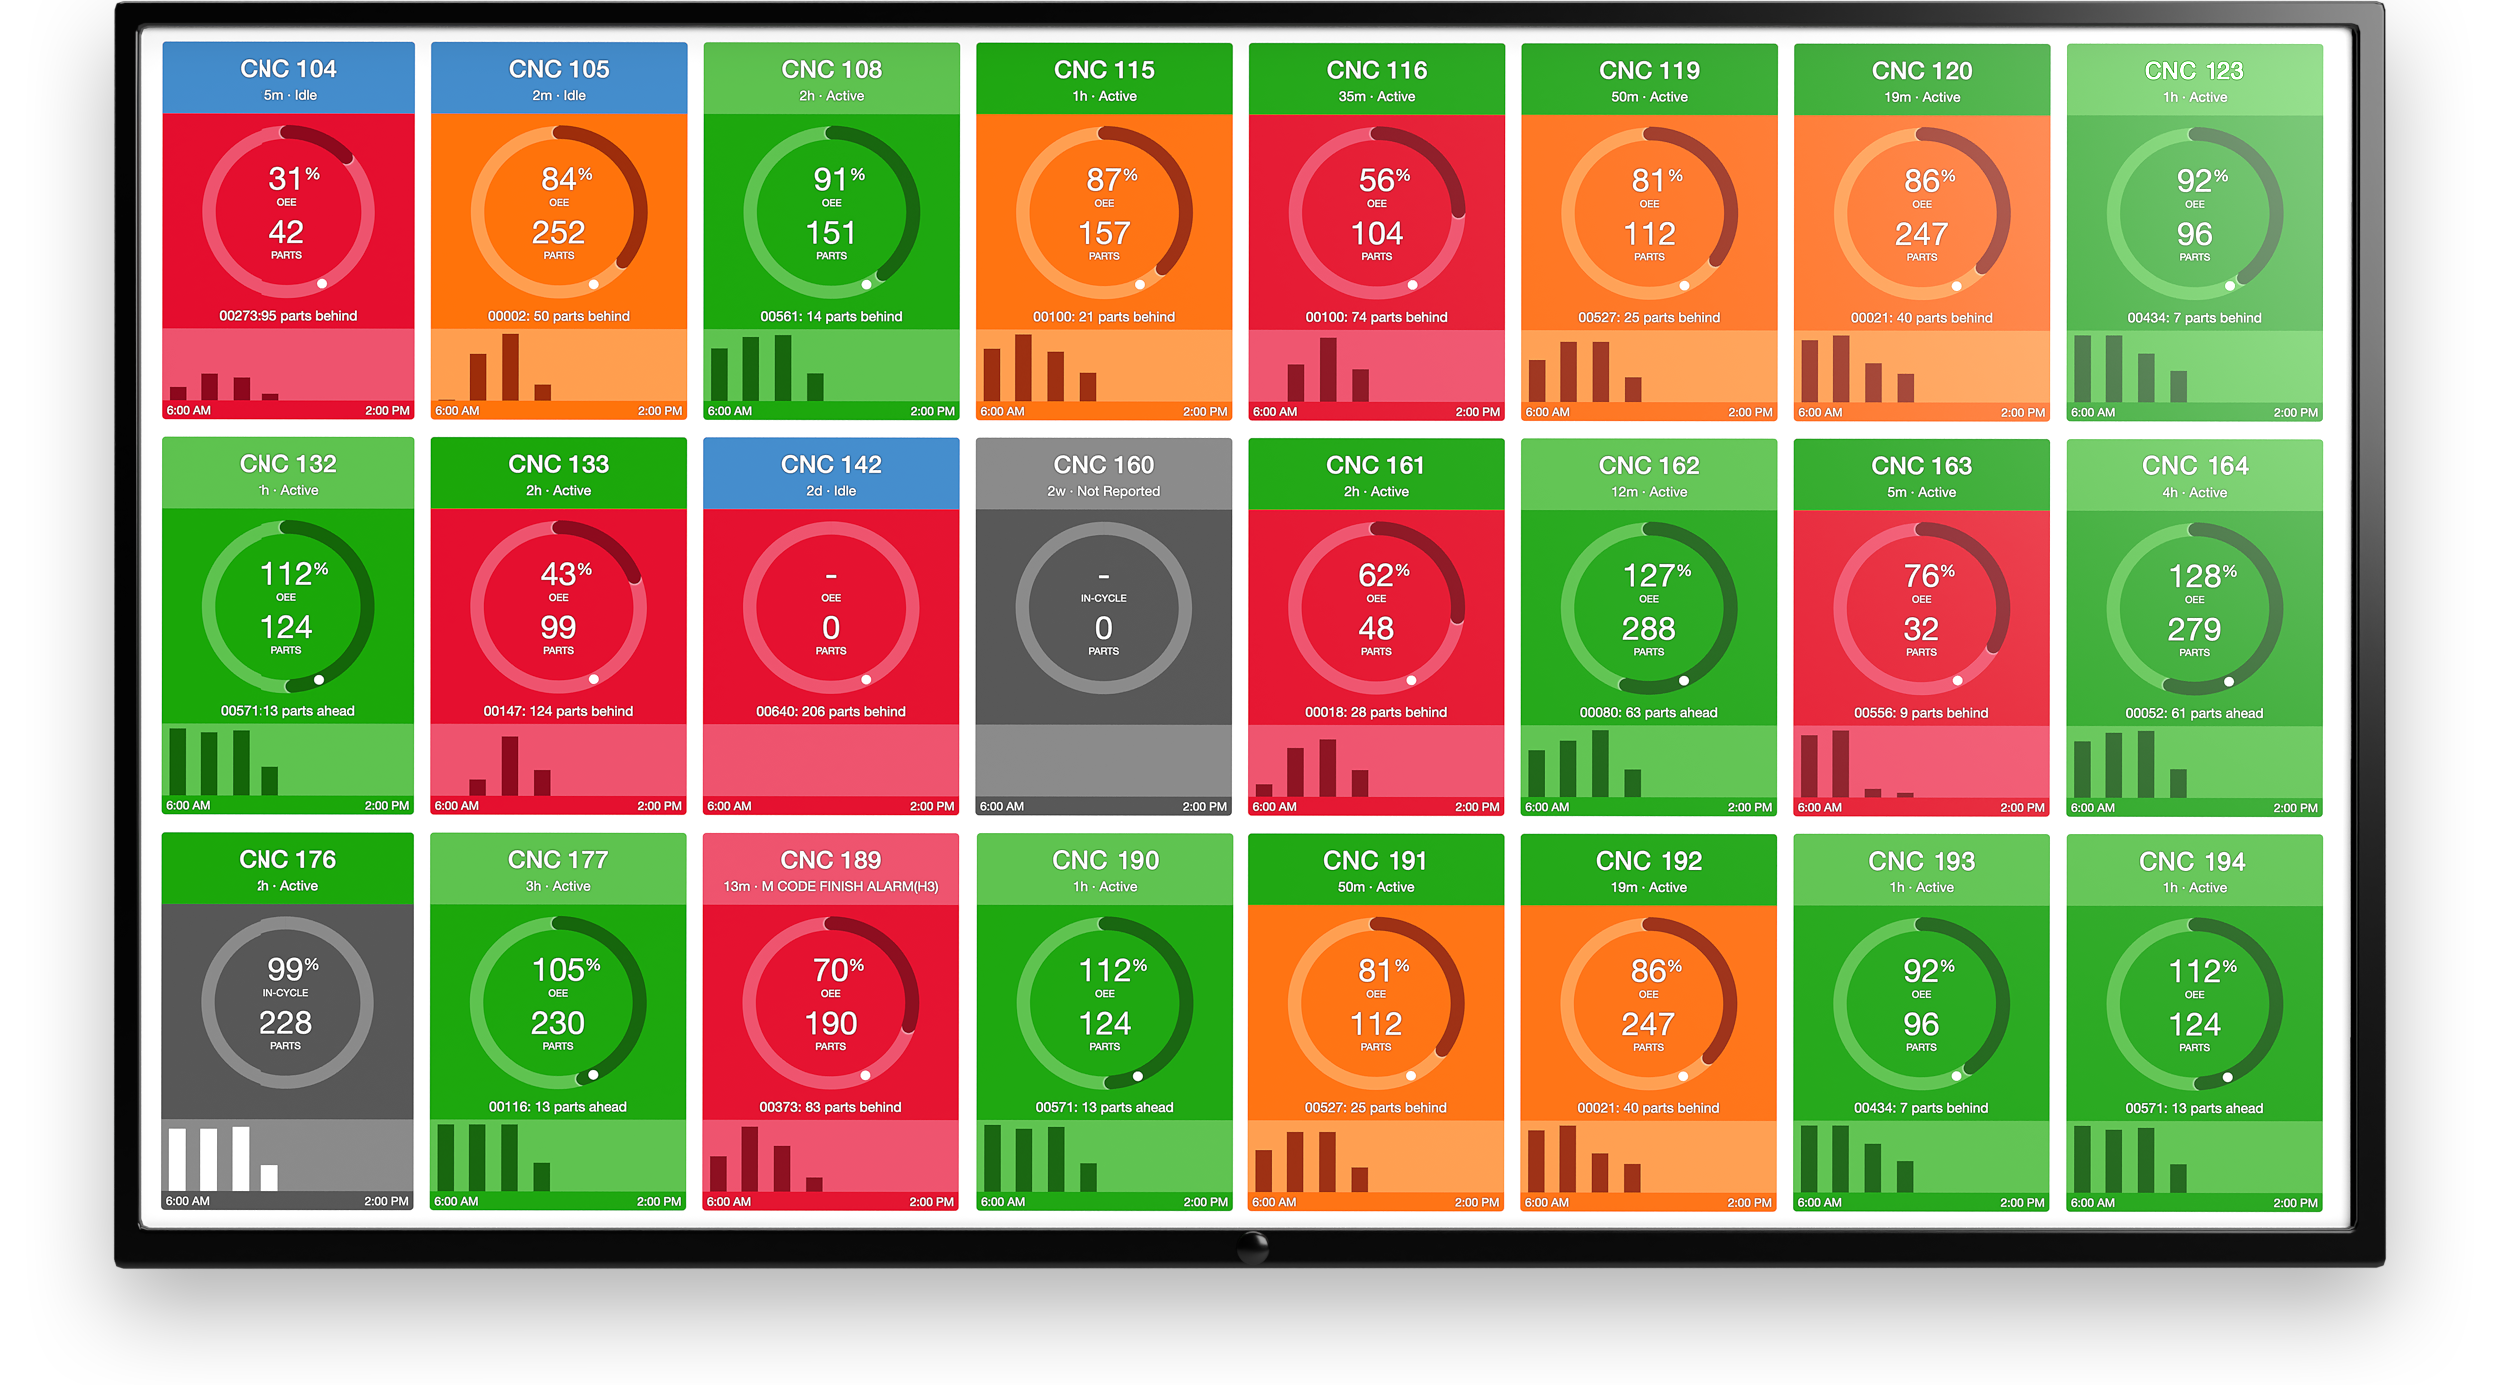
Visualize machine status and production efficiency in real-time with dashboards that include simple color-coded tiles.
Automatically collect production data from equipment without requiring any input from operators.
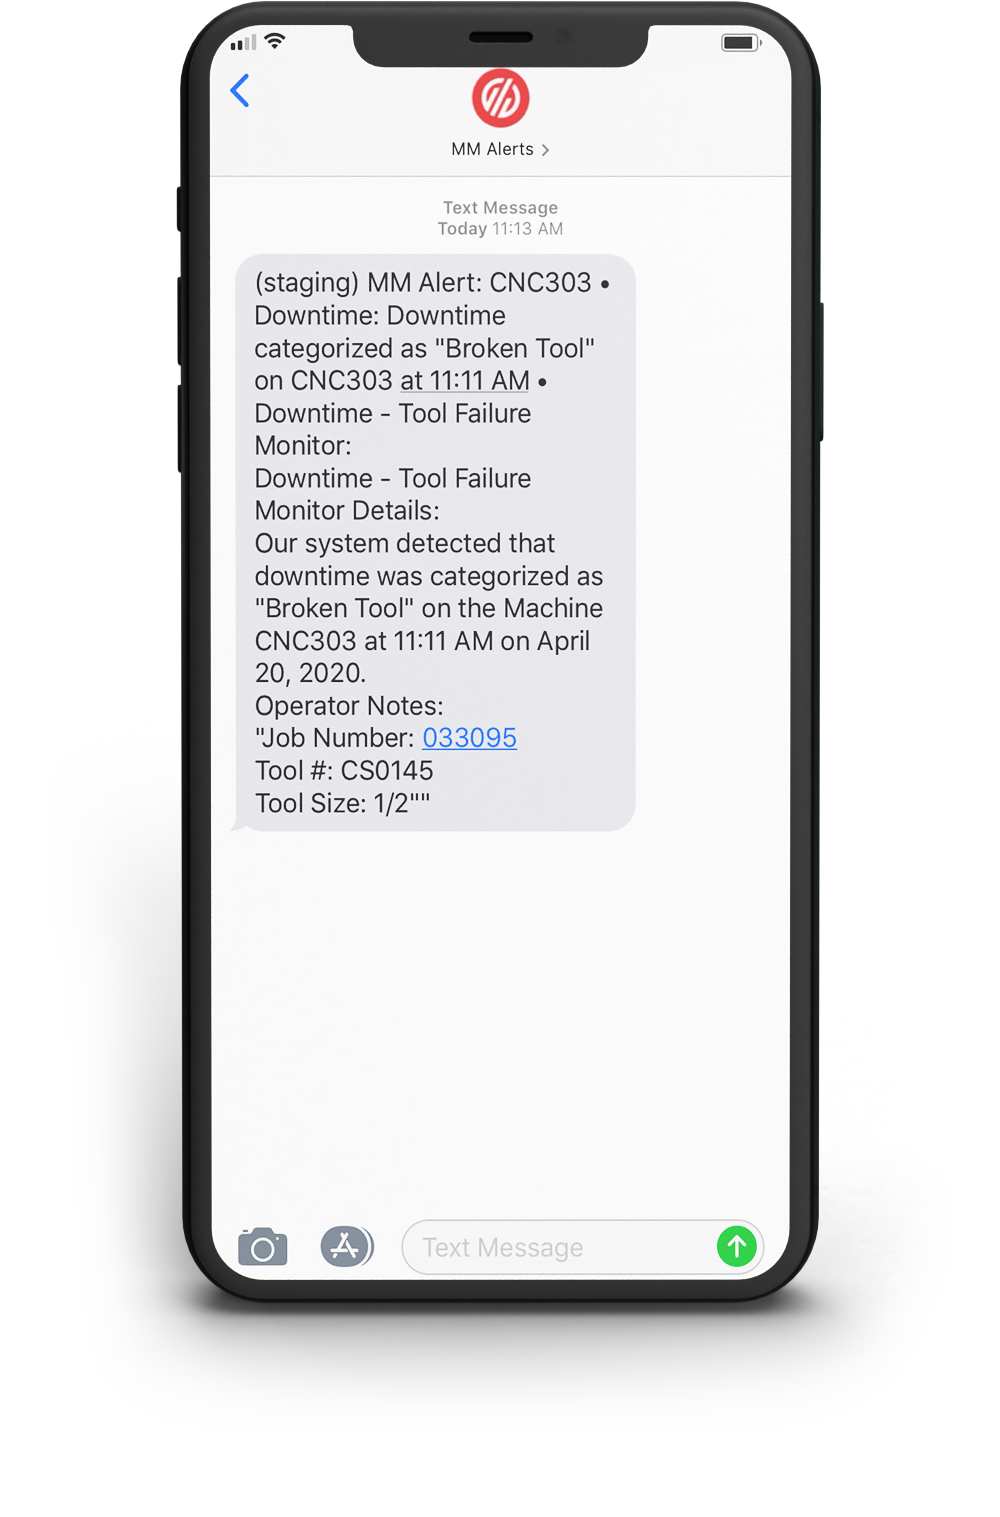
Alert the right person at the right time when action needs to be taken. Track incidents through workflows with reassignment, resolution, and full audit tracking.
MachineMetrics ensures you know exactly what’s happening on the shop floor, down to each individual part and work order. Establish accurate standards to plan, quote, and schedule more effectively.
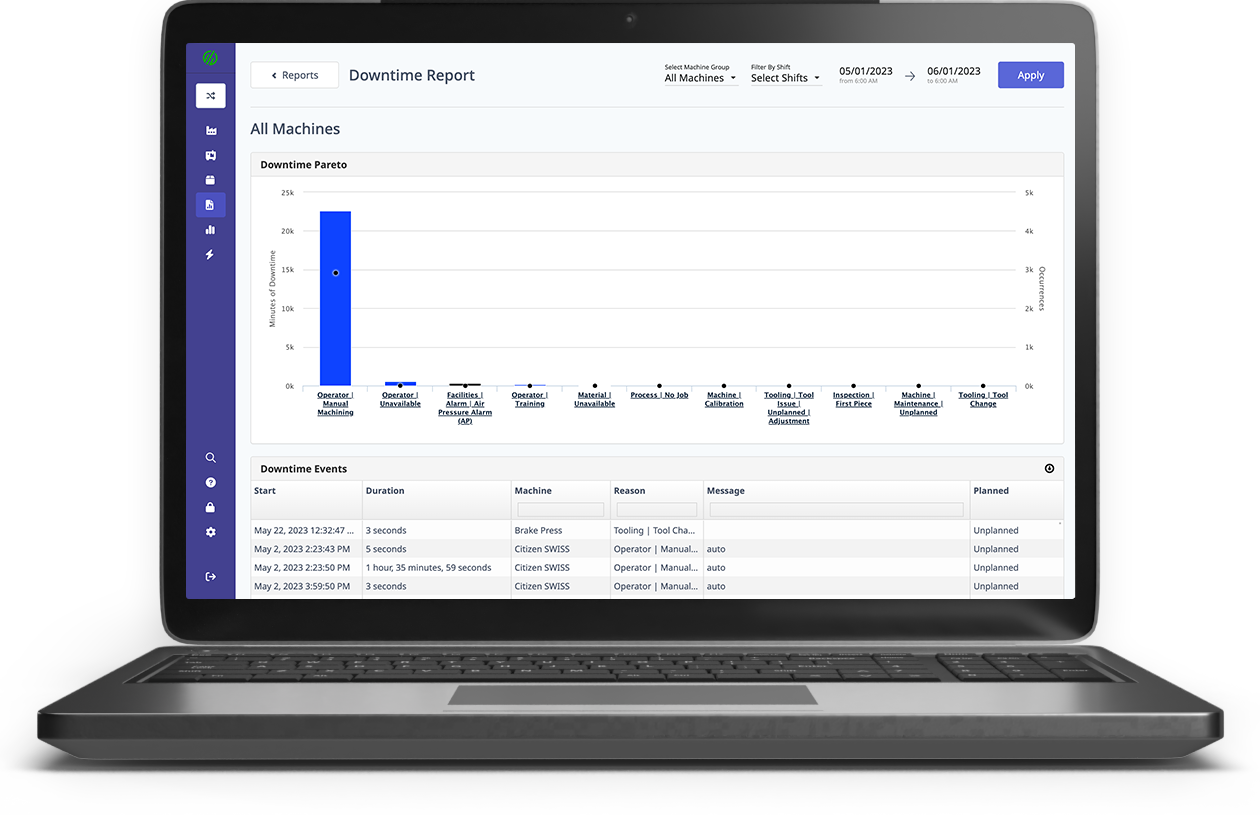
Report on downtime events and quality issues with Pareto charts to highlight the most common reasons for inefficiency.
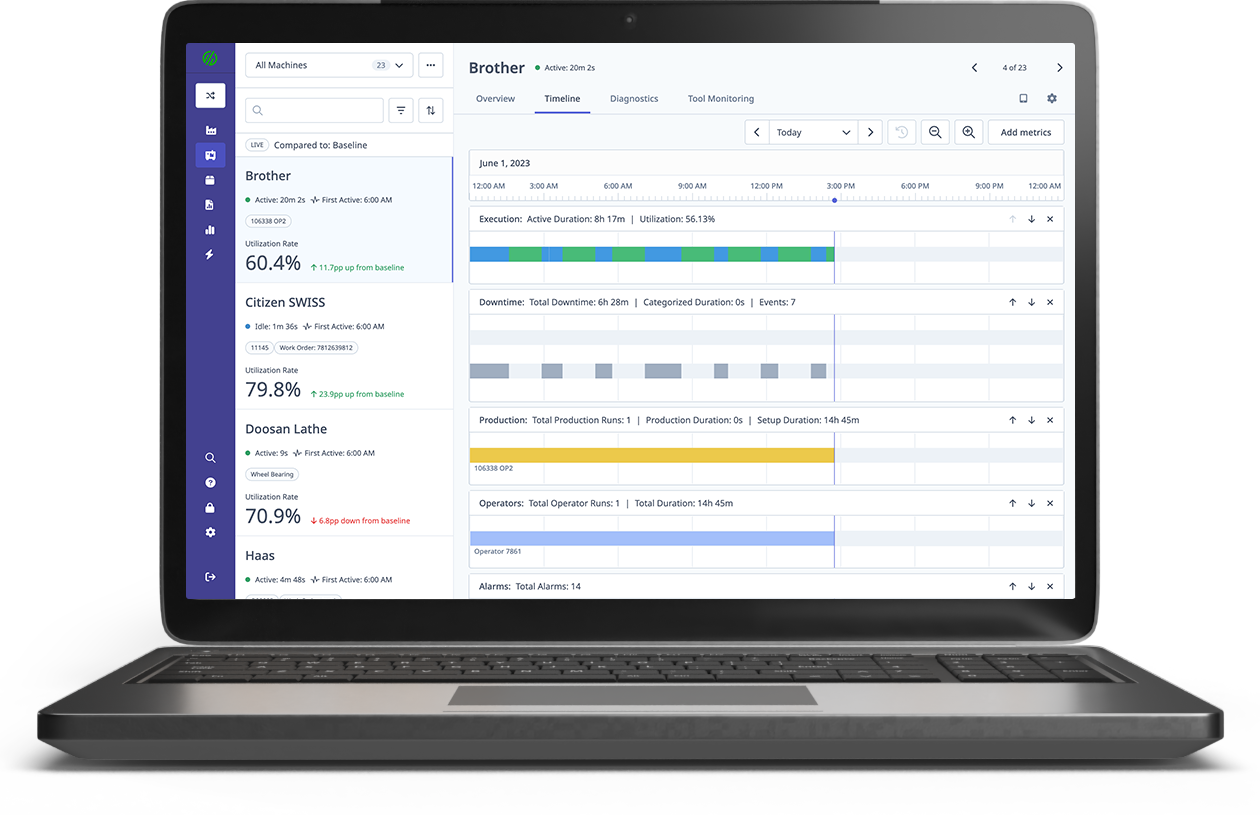
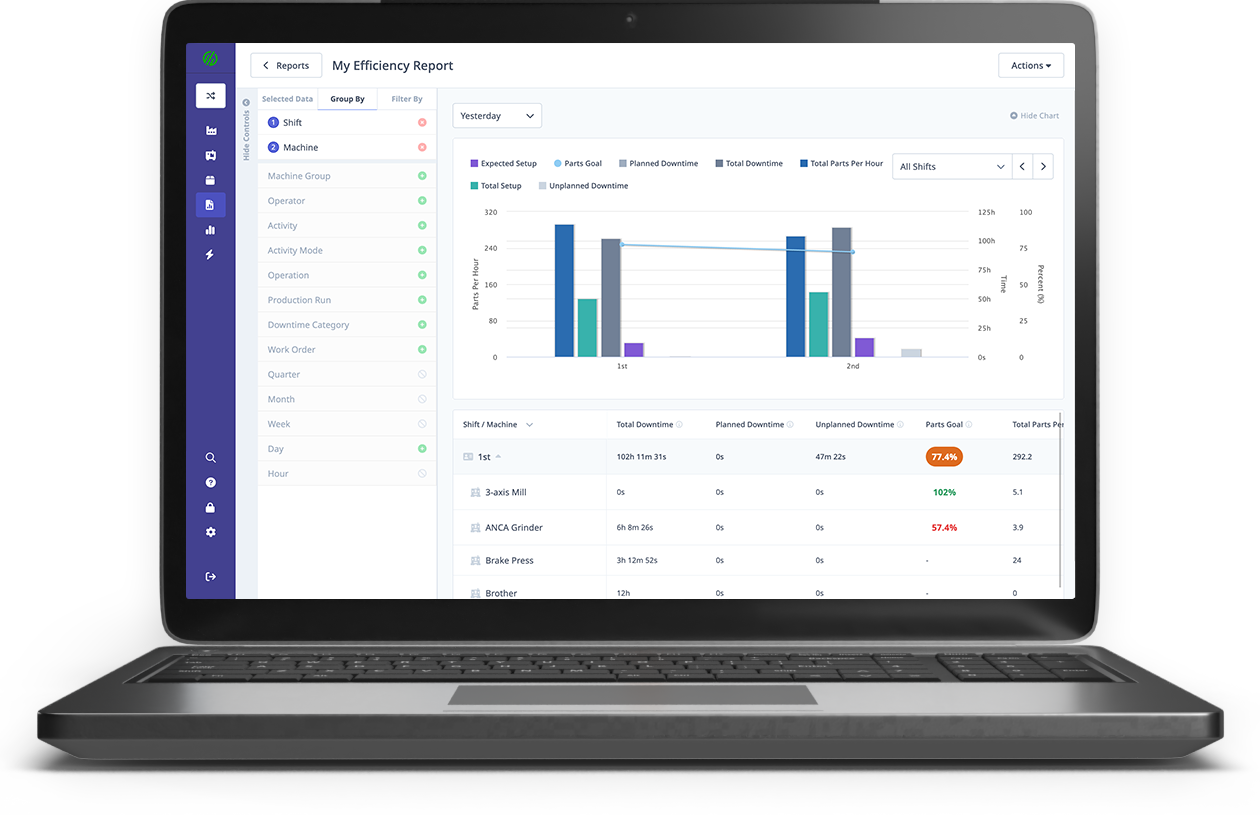
Monitor the performance of each production run, measuring it against historical data and breaking it down at the shift, cell, machine, and operator levels.
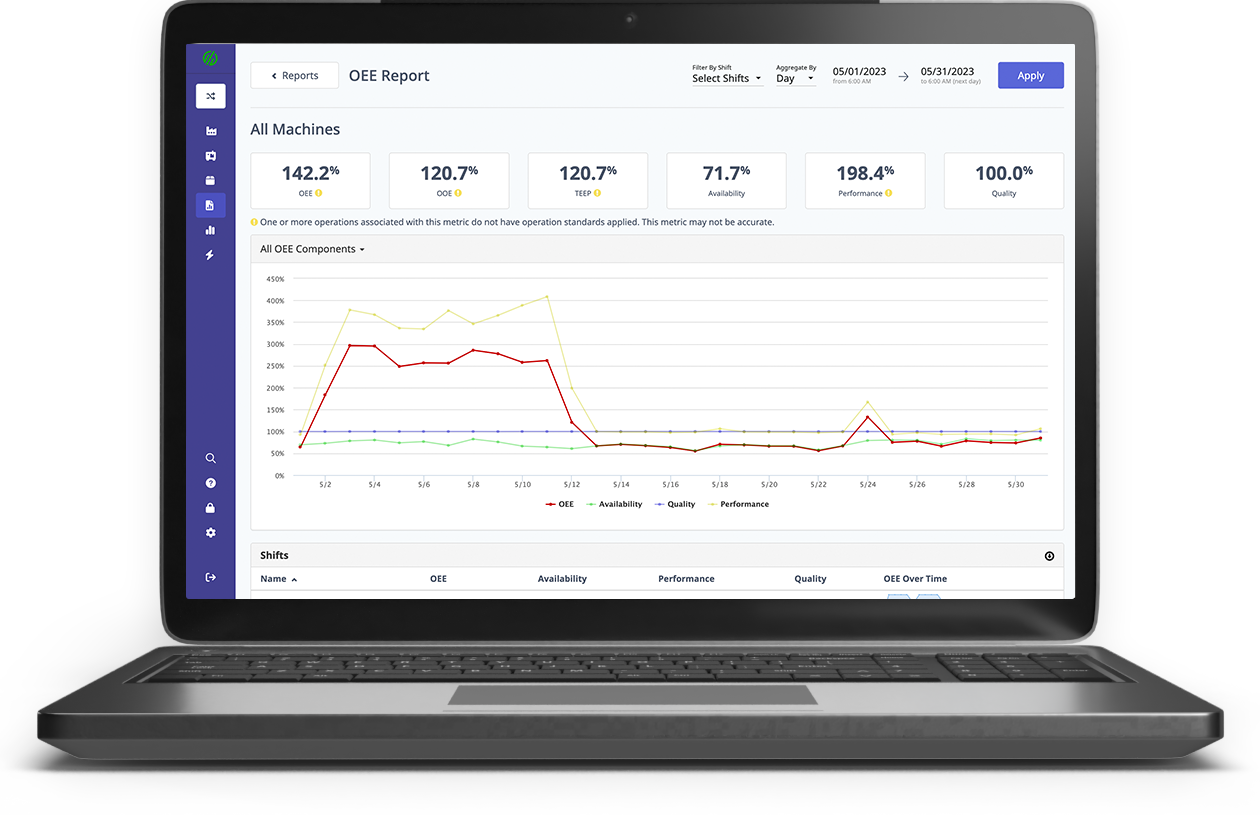
Visualize, analyze, and optimize actual cycle times for performance, machine availability, and quality metrics to monitor and improve OEE.


Join hundreds of Manufacturing organizations across the globe that use MachineMetrics software to collect, monitor, analyze, and take action on their manufacturing equipment data.


Book a tailored demonstration of MachineMetrics that aligns with your specific manufacturing needs.
Book A Demo Now
.png?width=1960&height=1300&name=01_comp_Downtime-%26-Quality_laptop%20(1).png)


.gif)


