MaxAI has arrived! Learn all about it
here
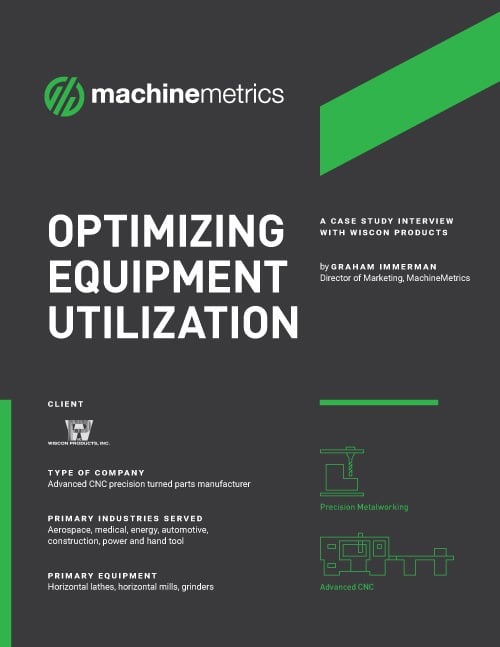
Wiscon Products of Racine, WI, produces quality precision parts for the aerospace, medical, energy, automotive, construction, and power industries.
In 2018, Wiscon began utilizing MachineMetrics at its facility in Racine to align with its core goals of process improvement, reduced downtime, and increased equipment utilization. The company wanted to serve its growing client base better and gain complete control of its data.
Wiscon’s core challenge was data accuracy. Its existing manual data collection methods made it difficult to capture and use data to make decisions and implement improvements. The data was often severely outdated - ranging from a few days to a week old - by the time it was reviewed. The management team at Wiscon realized they needed real-time data to measure, monitor, and analyze production and machine utilization.
The company also wanted insight into production downtime, cycle time, and equipment utilization. It struggled with questions such as how often spindles were turning and how many parts were being produced.
Wiscon’s deployment of MachineMetrics resulted in fast and significant efficiency gains across production, and it also gave teams complete visualization of real-time data. The company changed its approach from reactive to proactive and drove critical improvements in planning and scheduling processes.
Previously, Wiscon had invested over $16 million on equipment but always seemed to be running at capacity. And while production was always “busy,” there were gaps and delays in the data. This resulted in a lack of visibility and an inability to respond to issues quickly.
MachineMetrics provided critical benchmarking information that helped management realize the value of categorized downtime and accurate production performance. This guided the development of data-driven improvements to empower actionable decision-making. Wiscon gained control over its data and rapidly improved efficiency and OEE, driving astounding results in every facet of the operation.
MachineMetrics impacted Wiscon’s business in numerous ways. Management quickly realized that parts exceeding production goals drove a market opportunity to be more competitive. The company could also use real-time, actionable data to pinpoint problems concerning parts that exceeded cycle time; teams could now see errors in quotations, process failures, training issues, and more.
With access to high-quality, real-time data, Wiscon didn’t need to rely on employees to track problems manually. MachineMetrics’ native workflows and reporting enabled managers to address issues in real time, with data at their fingertips to use as a starting point for improvements in maintenance strategies or training.
The platform also integrated quickly with Wiscon’s existing ERP and QMS systems. This capability enabled operators to focus on quality instead of administration and data entry. The extensibility of existing systems gave Wiscon a considerable advantage in using real-time data to improve operator efficiency.
Wiscon’s adoption of MachineMetrics has transformed its production capabilities. The company has realized an increase in average machine utilization of 30%, corresponding to a rise of 30% in overall capacity. The use of real-time data and visibility throughout production has also increased average operator productivity by 250% and translated to a 48% increase in operator efficiency.
The company’s bottom line has seen significant improvement, and it has averaged an $84K increase in sales per employee per year.

Wiscon Products
Torben Christensen, President/CEO
Aerospace, medical, energy, automotive, construction, power and hand tool
Horizontal Lathes, Horizontal Mills, Grinders

Join hundreds of Manufacturing organizations across the globe that use MachineMetrics software to collect, monitor, analyze, and take action on their manufacturing equipment data.
Easthampton Office
116 Pleasant St, Suite 316, Easthampton, MA 01027