Downtime Tracking Software

THE CHEAPEST CAPACITY
YOU'LL EVER ADD.

Downtime is the largest source of lost capacity in discrete manufacturing, and the least understood. MaximaOS captures every stoppage from machine data, classifies it automatically, and prices it — so the hours you win back come from the machines you already own.
Downtime Hero-1

EVERY STOPPAGE.
EVERY DURATION.

Detected from machine data, classified by rules you control, explained by an operator only where judgment is required — and reconstructable to the minute whenever you need to know why.

The two-minute stoppages are where the hours hide.

Events are detected the moment they happen, straight from machine data, with no operator input and no minimum duration. The short stops nobody writes down get recorded like everything else, and collectively they outweigh every major failure. Detection starts the day a machine connects.
Production Analytics

Rules you control, applied the same way on every shift.

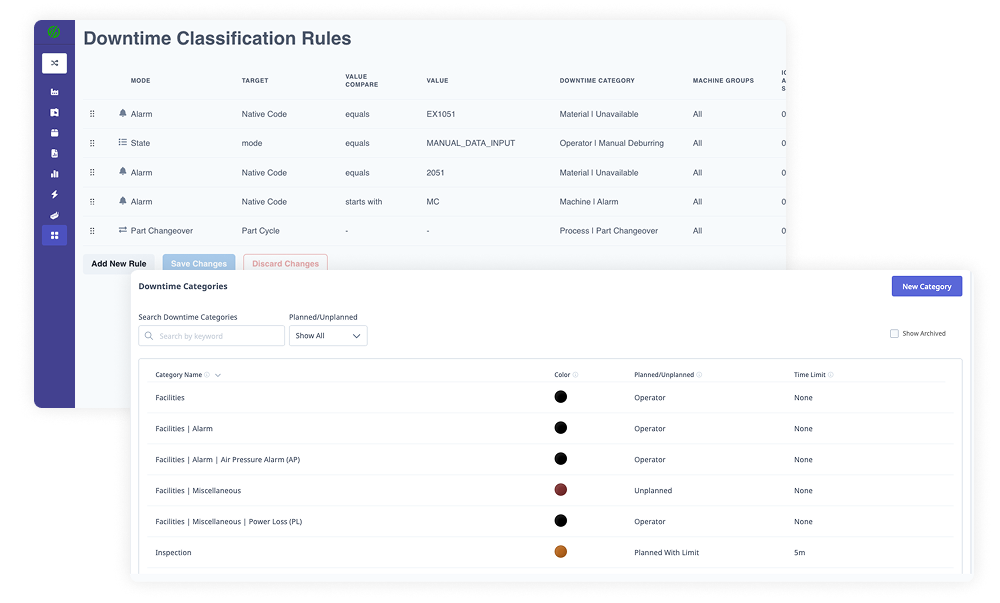
A configurable rules engine assigns reasons from alarms, alarm messages, and machine state, with contextual logic that accounts for timing and preceding events. Tune how long a machine must run before an event closes, and whether categorization spans the full stoppage or only the trigger window. Setup activity is detected on its own. Start from templates and refine as your data shows you what matters.
downtime rules

Ask the operator once, not forty times.

Events needing human judgment arrive grouped, with total counts and durations, so an operator resolves many at once. Categories and subcategories are yours to define, and notes capture the unusual cases. A long stoppage with more than one cause can be split so each is counted separately.
downtime categorizing

A report tomorrow is worth less than a text right now.

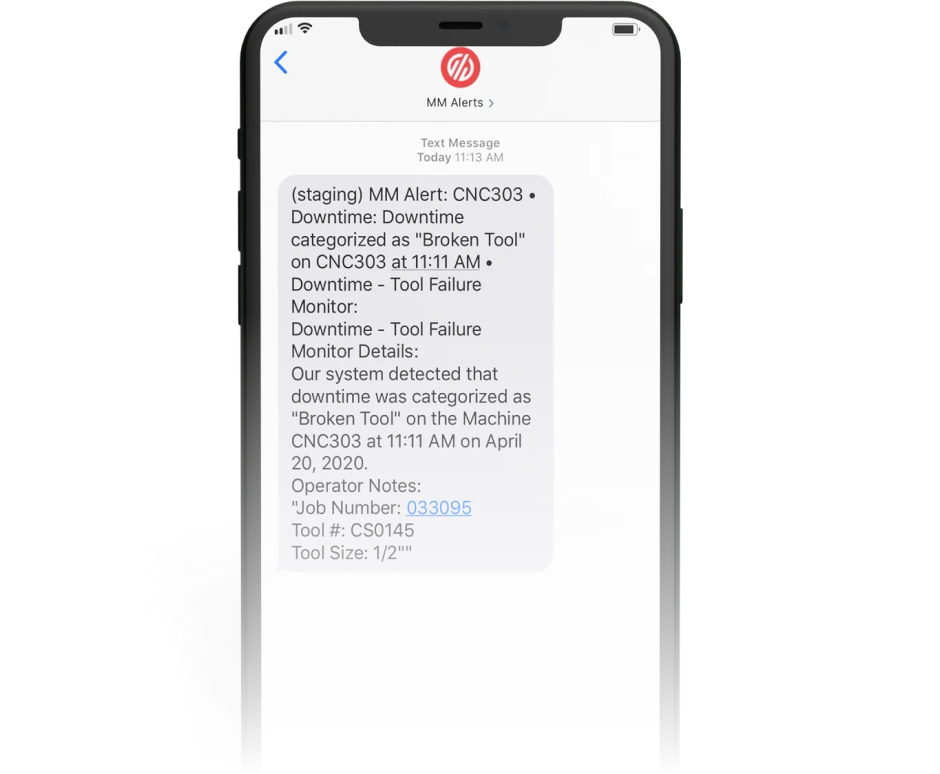
Notifications fire when a specific downtime type occurs, or when a machine has been down past a threshold you set, by email, text, or webhook. Webhooks reach the systems your team already works in, including CMMS platforms, so a work order opens while the machine is still down.
downtime text alert

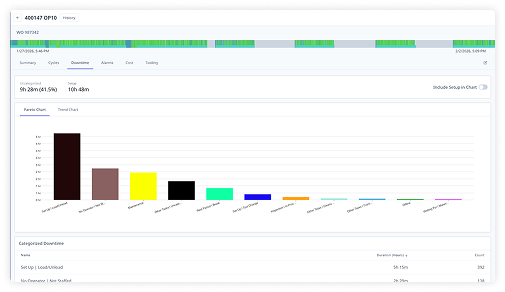
Rank your losses by what they cost, not how often they happen.

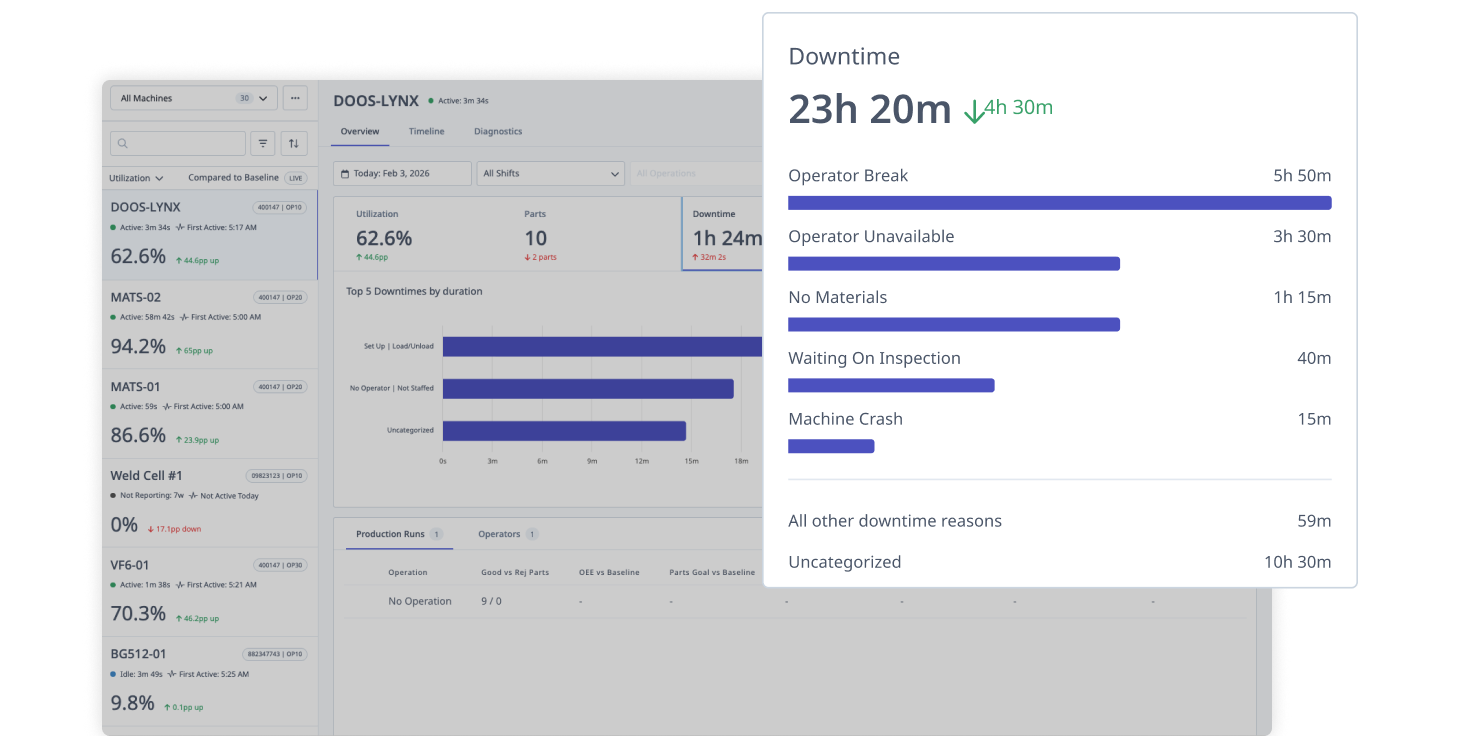
Causes ranked from highest impact to lowest in real time, with lost hours converted to lost revenue. Drill from a cause into the machines producing it, filter by shift or period, and compare against history to prove an improvement held. Standard reports ship out of the box, and a native builder covers the rest.
Frame 1000005954

Rewind to the minute it went wrong.

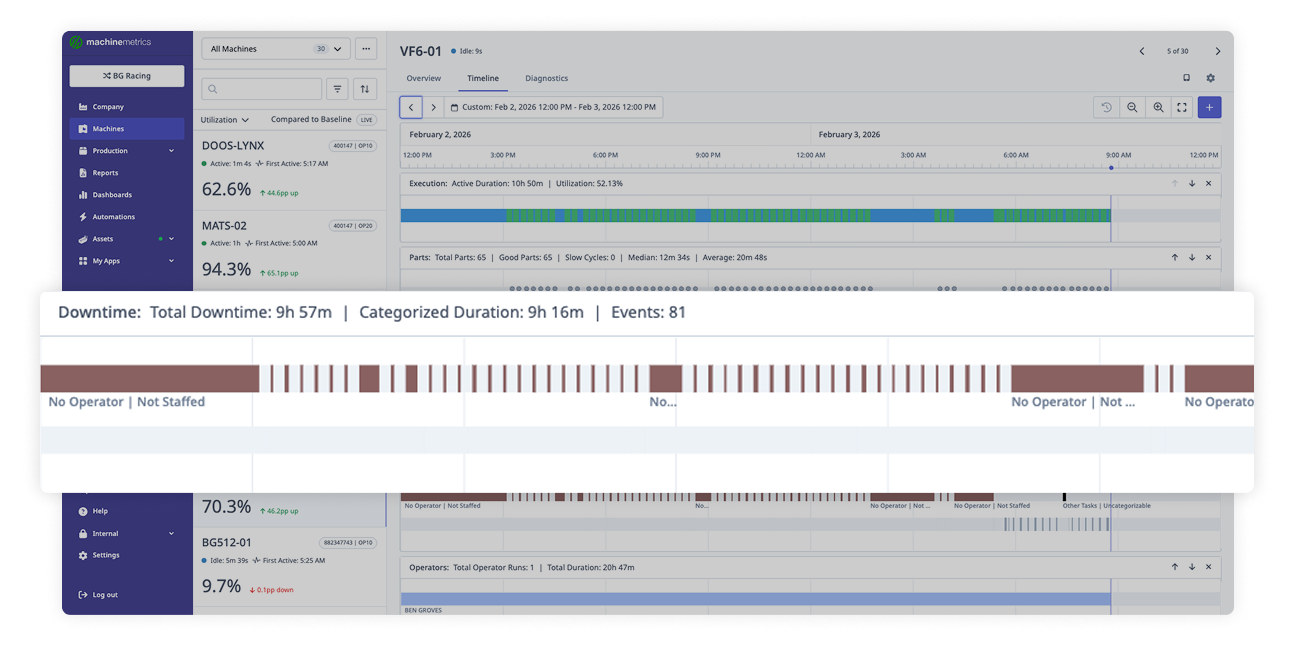
Every machine keeps an interactive record of status over time with diagnostic data alongside it: spindle and motor load, tool changes, temperature and vibration, alarms, part counts, and downtime categories. Zoom from a quarter down to a single minute and read the sequence that led to the stoppage. Reasons not categorized live can be documented after the fact.
downtime timelines

The machine stopped. The question is which job it cost you.

With ERP integration, downtime correlates to the job, part, and operation that was running, not just the machine. Machine alarms are tracked alongside downtime reasons in the same Pareto. Because categories are defined once for the organization, a code means the same thing at every site.
production-analytics-downtime 1
See It In Action

Capture happens in execution, analysis happens in optimization, and both run on the same record. Downtime and setup data feed labor and production reporting, which means your planning system stops assuming capacity the floor doesn't have. Operators train in under half an hour, and basic tracking is live within days of connecting a machine. UNCATEGORIZED IS NOT A ROOT CAUSE.

TESTIMONIALS

THEY FOUND OUT WHERE THE HOURS WENT.

Every stoppage is captured the same way, on every shift, including the ones nobody was there to see. The argument about whether the number is right ends, and the work of fixing it starts.
Explore Case Studies

THE OPERATORS GOT A VOICE.

 "Sometimes machines are down. Sometimes tools are not working right. Sometimes other things are happening that we're not accounting for."

- Efren Escobar, Director of Operations

305 HOURS BACK. NO ADDED LABOR.

305 production hours recovered in three months, with an 11% utilization increase and no added labor.

THEY WERE DECIDING BLIND.

"We were making decisions without really knowing what was actually happening."

- Jared Talladay, Operations Manager

Keep Exploring Solutions

Group 427322032
OEE

OEE & PRODUCTION ANALYTICS

Downtime as one loss among three, ranked against performance and quality.
Learn More
condition monitoring

CONDITION MONITORING

The stoppages worth preventing, caught on a threshold instead of a failure.
Learn More
quoting

CAPACITY & QUOTING

The recovered hours, priced and sold into weeks that would have run empty.
Learn More
schedulling

PRODUCTION SCHEDULING

The stoppages that break the schedule and the dates that move because of them.
Learn More

EXPLORE MORE CONTENT

WHAT IS THE EXECUTION GAP COSTING YOU?

calculator

Manufacturing ROI Calculator | What the Execution Gap Costs You

See what production gaps cost you in overtime, scrap, tooling, and maintenance, and how fast a modern MES pays for itself. Instant results.

Learn more

case study

How DNP Increased Asset Availability by 17% with Real-Time Machine Intelligence

How DNP turned machine data into action to increase asset availability by 17% with MachineMetrics and MaintainX

Learn more

blog

We Went to ProveIt! to Challenge a Popular Belief. Here's What Happened.

MachineMetrics CEO Bill Bither went to ProveIt! 2026 to challenge the idea that manufacturers have to build their MES from scratch. Here's what he proved.

Learn more

WEBINAR

The Blind Spots in Your ERP (And They're Costing You)

Join us for a financial conversation for leaders who want to understand where ERP numbers stop being trustworthy, and what it takes to close the gap.

Learn more