For Continuous Improvement Leaders

CONTINUOUS IMPROVEMENT THAT NEVER STOPS.

Measured baselines everyone trusts. Losses ranked by impact. Changes that prove value in days, with gains that stick after the project closes. This is continuous improvement, automated for the modern manufacturer.
TRUSTED BY MANUFACTURING LEADERS
THE PROBLEM

THE LOOP BREAKS AT ALL THREE POINTS.

Measure honestly, change deliberately, hold the gain. Most plants struggle at all three: weak baselines, slow feedback, and no way to catch performance drift after the project closes.

The result is familiar. Changes work, gains fade, and the backslide shows up months later. CI needs continuous visibility, not another spreadsheet.

MEASURE. ANALYZE.
IMPROVE. CONTROL. PROVE.

One loop, instrumented end to end: what you measure ranks the work, what you change reads out in days, what you hold funds the next cycle.

Set the baseline with deterministic metrics.

Calculate OEE, utilization, setup, and scrap identically from machine data against real schedules. Every loss counts, including the micro-stoppages manual collection misses — so the next project starts from a number nobody negotiates.
See measurement and metrics
OEE & Utilization

Rank losses by financial impact, not frequency.

Rank downtime causes by lost production value, then drill into the machines producing them. Effort goes where the money is rather than where the complaints are loudest.
See loss analysis
Frame 1000005954

Cut every metric by shift, part, and operator.

Segment every metric by machine, job, part, shift, operator, and reason to expose what the aggregate hides. Drill to the individual event, with condition and alarm history beside it.
See segmentation and drill-down
dripp down timeline

Read out the intervention the same shift.

See a change in the data the same shift, and compare that change point against prior periods on identical metrics. Push corrected standards to the ERP through approval, so the fix reaches quoting, scheduling, and capacity.
See instrumented improvement
setup times

Hold the gain with baseline-versus-actual tracking.

Calculate the pre-improvement baseline automatically and track performance against the target from the implementation date forward. Drift shows as it happens, with alerts on cycle drift, downtime spikes, and missed targets.
See segmentation and drill-down
Enterprise Dashboard 02

Fund the next initiative with priced evidence.

Convert losses to production value and price standards errors at your burden rate, so every initiative carries its own business case. Proof funds the next one, and the loop restarts from a better baseline.
See how losses get priced
Frame 1000005966
See It In Action

Tuffaloy knew they were losing time to manual bar loading but could not size it. Once bar changes were tagged automatically, the number came back at ten hours a month on every machine, and that funded the automatic bar loaders. TEN HOURS A MONTH, PER MACHINE.

TESTIMONIALS

THEY STOPPED DEFENDING THE NUMBER.

CI teams running measured baselines, dollar-ranked losses, and gains that held long enough to fund the next initiative.
Explore Case Studies

OFF BY 300%. NOW WITHIN 2%.

"I can't stress enough to have accurate utilization data. And with MachineMetrics, we're plus or minus two percent."

- Dave Roberts, Continuous Improvement Manager

35 MINUTES OVER, DOWN TO NINE.

Setups were averaging 101 minutes against a 66-minute standard, a 35-minute variance every time. With setup measured and worked as a process, they closed to within nine minutes of expected, and utilization roughly doubled.

FIND WHAT'S BROKEN. THEN FIX IT.

"Technology changes all the time, and finding what is broken in our system is essential to continuous lean improvement. MachineMetrics gives us that starting point to do exactly that."

KEEP EXPLORING TEAMS

Smiling-Operator-Trinity-Precision 2
operations

OPERATIONS

Live machine and job status, at-risk work flagged early, and downtime ranked by what it costs.
Learn More
wrench (7)

MAINTENANCE

The repeat failures at the top of your Pareto, and what it takes to stop them recurring.
Learn More
briefcase-1

EXECUTIVE LEADERSHIP

The business case behind the project, in the numbers leadership already trusts.
Learn More
hard-hat (3)

FRONTLINE WORKERS

The people whose adoption decides whether the gain holds after you leave the floor.
Learn More

EXPLORE MORE CONTENT

WHAT IS THE EXECUTION GAP COSTING YOU?

calculator

Manufacturing ROI Calculator | What the Execution Gap Costs You

See what production gaps cost you in overtime, scrap, tooling, and maintenance, and how fast a modern MES pays for itself. Instant results.

Learn more

webinar

From Disconnected to Data-Driven Webinar | March 26

Discover how ABACORP integrated MachineMetrics with their ERP to enhance manufacturing execution, improves decision-making, and optimizes production efficiency. Tune in March 26.

Learn more

webinar

From Machine Data to Guided Action

A candid look at what closing the execution gap actually looks like inside a precision machining shop

Learn more
WEBINAR

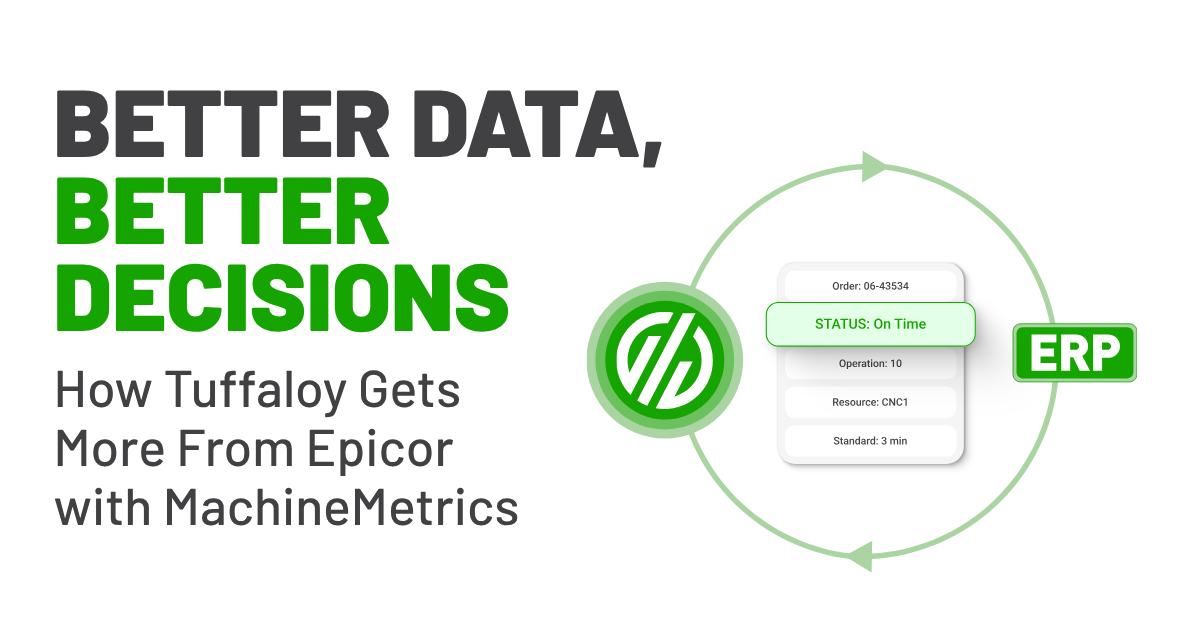
Better Data, Better Decisions

Your night shift operator says a part should take 10 minutes to run. Your ERP says 5. Who do you believe? Hear how one shop unlocked faster decisions, better reporting accuracy, and a more connected operation.

Learn more
sourced-Industry hero options (5)

MEASURE ONE PROCESS.
THEN PROVE IT HELD.

Connect a sample of machines, set a baseline from real data, and see what the losses actually cost.