OPTIMIZE

Manufacturing Analytics Solutions

EVERY SECOND.
EVERY DOLLAR.

Automated production analytics built on machine truth, not manual entry. Surface what's actually keeping your plants off target and transform it into actions that help you solve problems before it hurts your bottom line.
Group 427322010 (1)

CAN YOUR MES OPTIMIZE THIS?

Rank downtime by dollars
Find incorrect ERP standard times
Overlay a week of spindle loads
Build dashboards from a sentence
Separate setup time from run time
Prove kaizen gains still hold
Compare OEE across eleven plants
Find common downtime across sites
See vibration before machine stops
Email metrics before the meeting
Explain why utilization is 30%
Track planned versus actual times
Turn questions into action plans
Trace scrap to its exact source
Give executives a reason to log in
Measure goals against real baselines

THE GAPS YOU CAN'T SEE ARE THE ONES COSTING YOU THE MOST MONEY.

Group 427321849 (2)
ruler-dimension-line

A NUMBER NOBODY TRUSTS FUNDS NOTHING.

When the data depends on someone remembering to enter it, your largest downtime category is "uncategorized" and OEE becomes a debate. No one signs a capital request against a metric they can argue with.
file-text

THE REPORT ARRIVES AFTER THE DECISION.

Managers spend hours a day reconciling ERP data against what production actually did. By the time the number is ready, the shift it describes is over, and the moment to act is long gone.
lightbulb (3)

INSIGHT ISN’T ACTION.

A chart tells you something went wrong. It doesn’t tell you which problem to fix first, what it costs, or whether the fix held. That still takes someone with context, experience, and time — and most plants are short on all three.

AN OEE NUMBER YOU CAN ACTUALLY DEFEND.

Most OEE numbers can't survive a follow-up question. Yours will, because every figure carries the job, the program, the operator, and the shift behind it. Now, when someone asks why availability dropped on Tuesday, the answer is presented in real-time without a week's worth of digging.

Defined once. Used everywhere.

Set the definition once. Shift calendars, working hours, planned downtime. Every site inherits it. Machines report against it automatically, and automated program matching identifies which operation is running where. The cycle time analysis is built before anyone asks for it.
See how production analytics work
message-circle-plus
NO EXPORT NECESSARY
Slice OEE, cycle time, and quality by machine, shift, job, part, program, or operator. Roll it up across a plant or drill into one operation, without exporting anything.
eye
SURFACE THE DISCREPANCIES
Automatically surface which cycle time standards have been wrong, and how long they have been quietly distorting your quotes and your capacity plan.
sparkles (4)
MAXAI FINDS IT FIRST
MaxAI reviews performance continuously and brings you the discrepancies, so the analysis happens whether or not anyone has time to look this week.

STOP GUESSING WHICH PROBLEM COSTS THE MOST.

Most plants either can't name their top bottlenecks or spend weeks of analyst and operator time discovering them. MaximaOS categorizes downtime from machine signals, alarms, and program states, ranks the losses by what they cost, and asks operators only about the gaps the machine can't explain. You get the list of what to attack without putting anyone on a study.

Know which problem is worth a project.

Find the constraint, not just the stoppage. Compare loss across shift, machine, and cell to see whether the problem is one asset or one process. Sort by cost to separate the machine that stops constantly from the one whose stops actually cost you. Ask MaxAI which repeat failures are worth attention this month.
See how downtime analysis works
book-open-check
DETECT EVERY STOPPAGE
Stoppages are captured from machine data with no minimum duration and no operator input, so the two-minute stops that outweigh every major failure land in the record too.
circle-dollar-sign (2)
PRICE THE PARETO
Causes are ranked by lost revenue, not frequency. Drill from a cause into the machines producing it, and fund the project with the largest number behind it.
downtime
REWIND THE TIMELINE
Zoom from a quarter down to one minute with spindle load, temperature, vibration, and alarms alongside the status bar. See the sequence that led to the stop.

BUILD IT YOURSELF. OR JUST ASK.

Every manufacturer eventually needs a view nobody shipped: your metrics, your cells, your definition of a good shift. The usual answers are a BI project running on yesterday’s export, or a change request that waits in someone’s queue. MaximaOS is built on widgets, so the view you need is a drag away... or a sentence.

Hundreds of reports out of the box. Yours in minutes.

Start from hundreds of prebuilt dashboards and reports designed around real production use cases, then drag, drop, resize, and filter until it matches how you actually run. No custom code, no development ticket. Then schedule it — daily, weekly, or monthly, to the people who need the numbers but will never log in to get them.
See how reporting works
wrench
CONFIGURABLE TO YOU
A widget architecture means changing a dashboard is an afternoon’s decision, not a scoped project. Every report is assembled from the same components.
sparkles (4)
ASK MAX
Describe the dashboard or report you want in plain language and MaxAI builds it, using the same widgets you would have dragged yourself. Keep it, or keep going.
send
DELIVERED, NOT FOUND
Scheduled reports land in the inbox before the morning meeting, so the plant manager and the executive see the same numbers as the floor without chasing them.

IMPROVEMENTS THAT DON’T BACKSLIDE.

The kaizen event goes well. The numbers move. Six months later nobody can say whether the gain is still there, because the only evidence was a slide from the week it happened. Most improvement programs don’t fail at the improvement — they fail at the part where you prove it held and then do it again.

Measured against your own baseline, not a number someone picked.

MaximaOS calculates the pre-improvement baseline from your own production history, then tracks performance against it from the day the change went in. Schedule attainment shows how closely execution actually matched the plan — on-time starts, on-time completions, and planned versus actual timing for every work order. When the trend drifts, you find out while it’s still a drift.
See how improvement tracking works
calendar-check (1)
SCHEDULE ATTAINMENT
One percentage for how well the floor executed the plan, at day or hour granularity, with scheduled versus actual start and finish for every work order behind it. An objective KPI instead of a debate.
arrow-down-to-line
BASELINE, NOT A TARGET
Goals tracked against performance the platform derived from your own history, so “better” is measured rather than asserted — the evidence the Control phase of DMAIC actually requires.
sparkles (4)
MAXAI PICKS THE NEXT ONE
Ask what to focus on and MaxAI returns a prioritized improvement plan with the quick wins called out, so the next project is chosen on cost rather than on who argued hardest for it.

ONE STANDARD ACROSS EVERY PLANT.

Most multi-site manufacturers can’t compare their own plants, because each one measures differently and every rollup is a manual exercise that’s stale by the time it’s read. When every site connects into the same data model, comparison isn’t a normalization project — it’s a filter.

Aggregate, compare, drill, and prove it held.

See utilization or OEE across the entire footprint, then click into a plant, a cell, a machine. Put sites side by side on the metrics that matter and see where the gaps are. When one plant solves something, find out immediately whether the same cause is running at the other ten — and turn one site’s fix into the standard everywhere instead of a story people tell after a site visit.
See how enterprise analytics work
logs
AGGREGATE AND DRILL
One number for the whole footprint, and the path from that number down to a single machine. Deploy on the KPIs and sites that matter now, expand from there.
git-compare-arrows
COMPARE SIDE BY SIDE
Standardized metrics per plant, ranked. Best practice stops being an anecdote from the site visit and becomes something you can see and copy.
sparkles (4)
ENTERPRISE AI
The same failure showing up at four plants reads as four local problems until something looks across all of them. MaxAI does, and names the shared cause once.
See It In Action

Epicor could tell Tuffaloy when an operation started and ended. It couldn’t show what happened in between. MaximaOS reveals the hidden downtime, from missing tools to material changes, so the team can quantify where time is actually going. YOU CAN’T FIX WHAT YOU CAN’T SEE.

KEEP EXPLORING

Maxima stack
icon-small
connect

EVERY MACHINE.
EVERY SIGNAL.

The foundation. Any machine talking in seconds, new or old.
Learn More
arrow2
OPTIMIZE

EVERY INSIGHT. 
EVERY METRIC.

See where you are losing and what to do about it.
Learn More
Group 427321991 (1)
EXECUTE

EVERY JOB. EVERY SHIFT.

The MES layer that runs the plan on the floor.
Learn More
arrow3
Build

EVERY WORKFLOW. EVERY APP.

Close your floor's unique gaps in days.
Learn More

EXPLORE MORE CONTENT

case study

Paragon Medical Doubles Capacity with No Additional Machines

With the ROI of a three-month pilot at one facility, Paragon Medical was able to pay for the deployment of MachineMetrics across the entire company.

Learn more
webinar

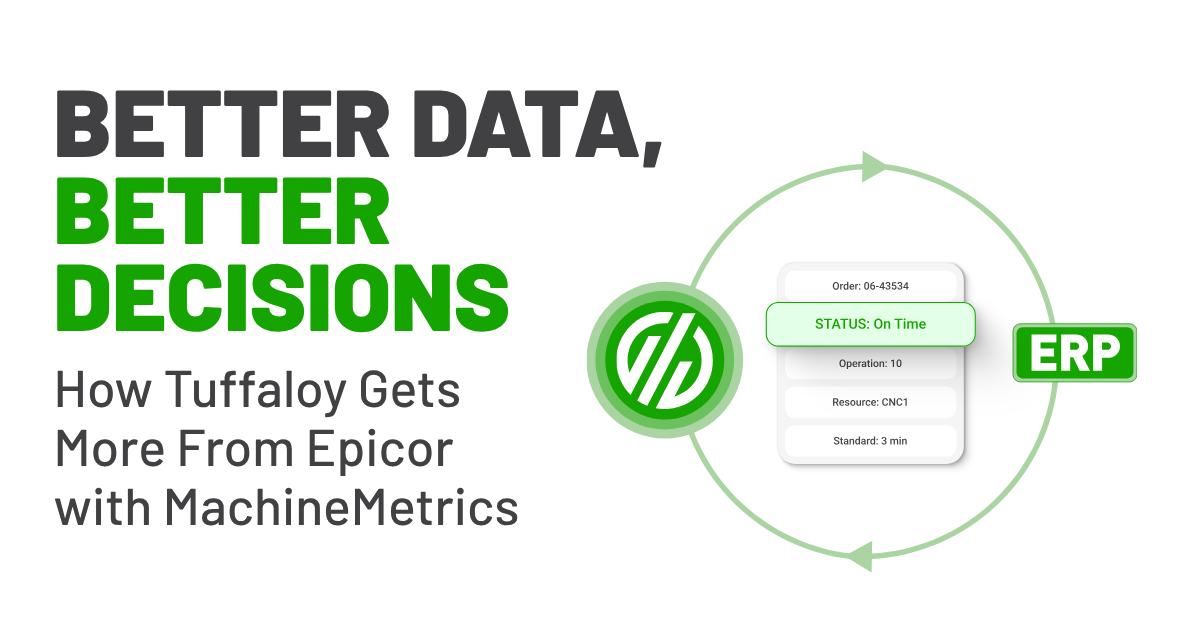
Better Data, Better Decisions

Your night shift operator says a part should take 10 minutes to run. Your ERP says 5. Who do you believe? Hear how one shop unlocked faster decisions, better reporting accuracy, and a more connected operation.

Learn more

CASE STUDY

Optimizing Overall Equipment Efficiency and Utilization at Avalign

In this exclusive interview-style case study, Director Matt Townsend discusses the impact of deploying MachineMetrics at Avalign Technologies.

Learn more
WHAT IS THE EXECUTION GAP COSTING YOU?

calculator

Manufacturing ROI Calculator | What the Execution Gap Costs You

See what production gaps cost you in overtime, scrap, tooling, and maintenance, and how fast a modern MES pays for itself. Instant results.

Learn more