
Book a Demo of MachineMetrics
The leading platform to collect, monitor, analyze, and drive action with machine data. Set up time with a product specialist to learn how we can help your operation.
Ready to empower your shop floor?
Learn More.svg)

As our daily utilization updates gain steam and receive more attention, we feel it’s important as data stewards to clarify our assumptions, any sources of bias we may have, and our margins of error in order for organizations to make the most informed decisions from our numbers.
Like with any dataset, our data contains bias, and therefore we attach a margin of error to any of our reported metrics. It is important as data practitioners to be transparent about these sources of bias, our assumptions on the data, and how we address these concerns in our methodology. This allows you, the user, to make your own judgments about the veracity of our claims and the value of our data to your organization.
If we view our dataset from the perspective of traditional polling (like you see on TV for who’s ahead in the presidential primary), we can consider each of our machines a “person” which we “poll” or survey. The question we are asking for this poll is simply: “What has your utilization been on average, these past seven days?” We sample thousands of “people” (machines) across the United States every second via our fleet of cloud-connected Edge devices, and report this figure for the previous day once all the “answers” are “in”.
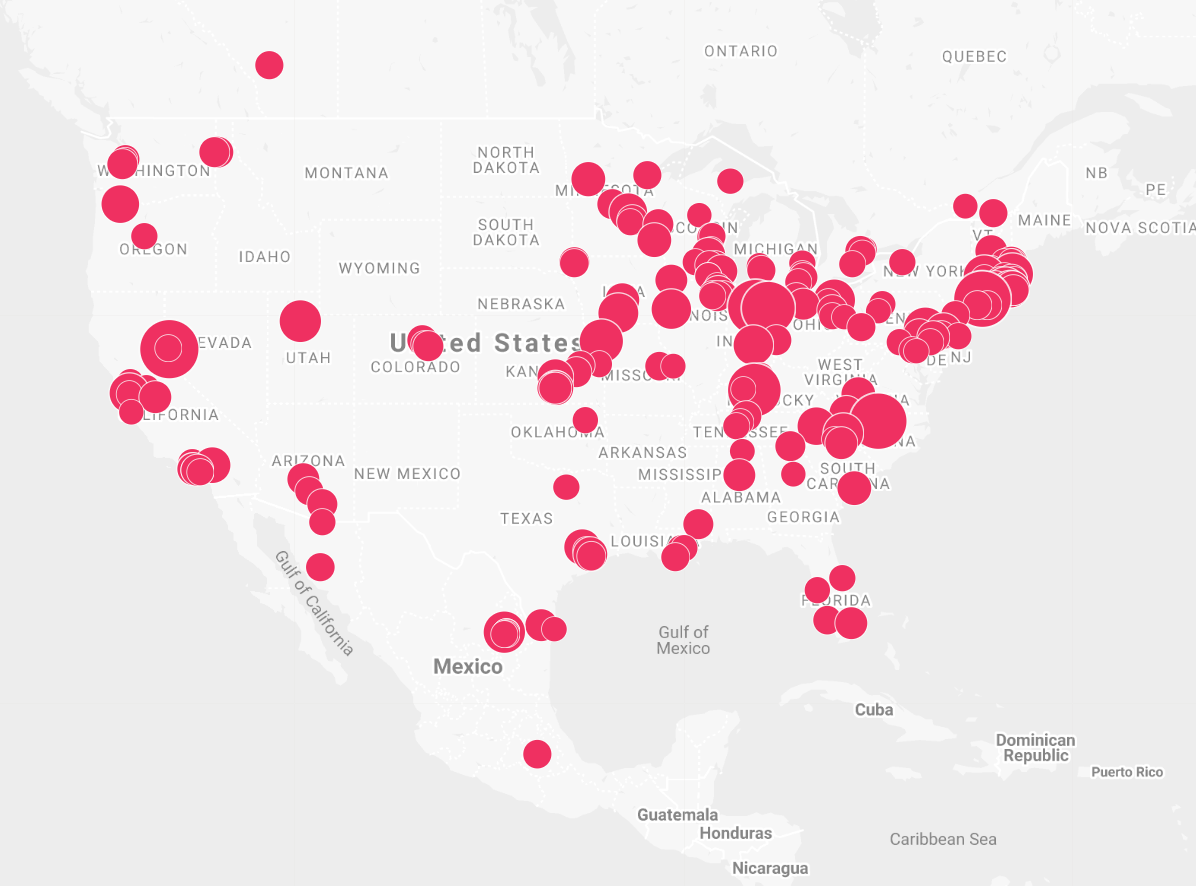 Where the "people" (machines) we sample reside.
As with any poll that does not capture the entire population, our sample is subject to bias. As addressed in our previous posts, certain forms of bias are not applicable in our methodology - namely emotionally-driven ones like perception bias, confirmation bias, and malicious reporting. Machines are automatically polled via software every second - they cannot “lie” or tell untruths because there is no opportunity to do so when they are tethered to MachineMetrics. Technological glitches are nominal as well, as utilization is the most basic metric we poll from machines and any anomalies are algorithmically detected and quickly rooted out. However, other forms of bias still exist even when you take the human element out.
First, our sample likely represents a high-productivity sample of manufacturing. This is because those who adopt Industry 4.0 technologies are the shops that are more forward-thinking, and therefore probably already have processes in place to streamline operations and increase throughput. We are not entirely sure how many percentage points more productive our sample is than “average” discrete manufacturing, but we do not believe that the overall trends should be affected by this (that is, the percentage change from day to day should be similar for a high-productivity sample vs. an average-productivity sample). This is because macro-level factors like holidays, economic shocks, and onshoring/offshoring should affect high and low productivity shops relatively equally. This is important because while the overall level of utilization we report is slightly elevated, we can still see very clear trends like the effect of holidays, the effect of coronavirus, and the effect of pent up consumer demand on manufacturing as a whole.
In addition, we do not capture a perfect population-level Census of machine usage across the United States, as that would require being attached to all 3-million+ machine tools (the 3 million number comes from The Association for Manufacturing Technology, which estimates that there are 3.2 million operational CNC machine tools that have an original value over $50k).
While we do aspire to get to 3 million one day, right now we have to settle for a fraction of this total size. We do not reveal our exact sample size due to the fact that we charge a standard price per machine, and that would reveal our annual recurring revenue, a figure most startups of our size are not willing to disclose because it plays a key role in valuations.
However, we do include a margin of error as best practice, which is typically what sample size tries to get at anyways. A margin of error takes into account the sample size as a proportion of the total population size, as well as the percentage of respondents who respond affirmatively to the survey. In our case, there is no “affirmative” response to the survey - we could theoretically take 100% utilization to mean “everyone said yes” and 0% to mean “everyone said no”, but this is suspect. Therefore, we simply use a 50% proportion for affirmative responses in our calculation, which maximizes the margin of error for the most conservative measures of survey accuracy. You can rest assured that the margins we report are for the worst-case scenario given our sample size.
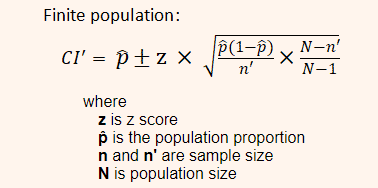 Margin of error formula for finite populations. Source: Chegg Homework Help
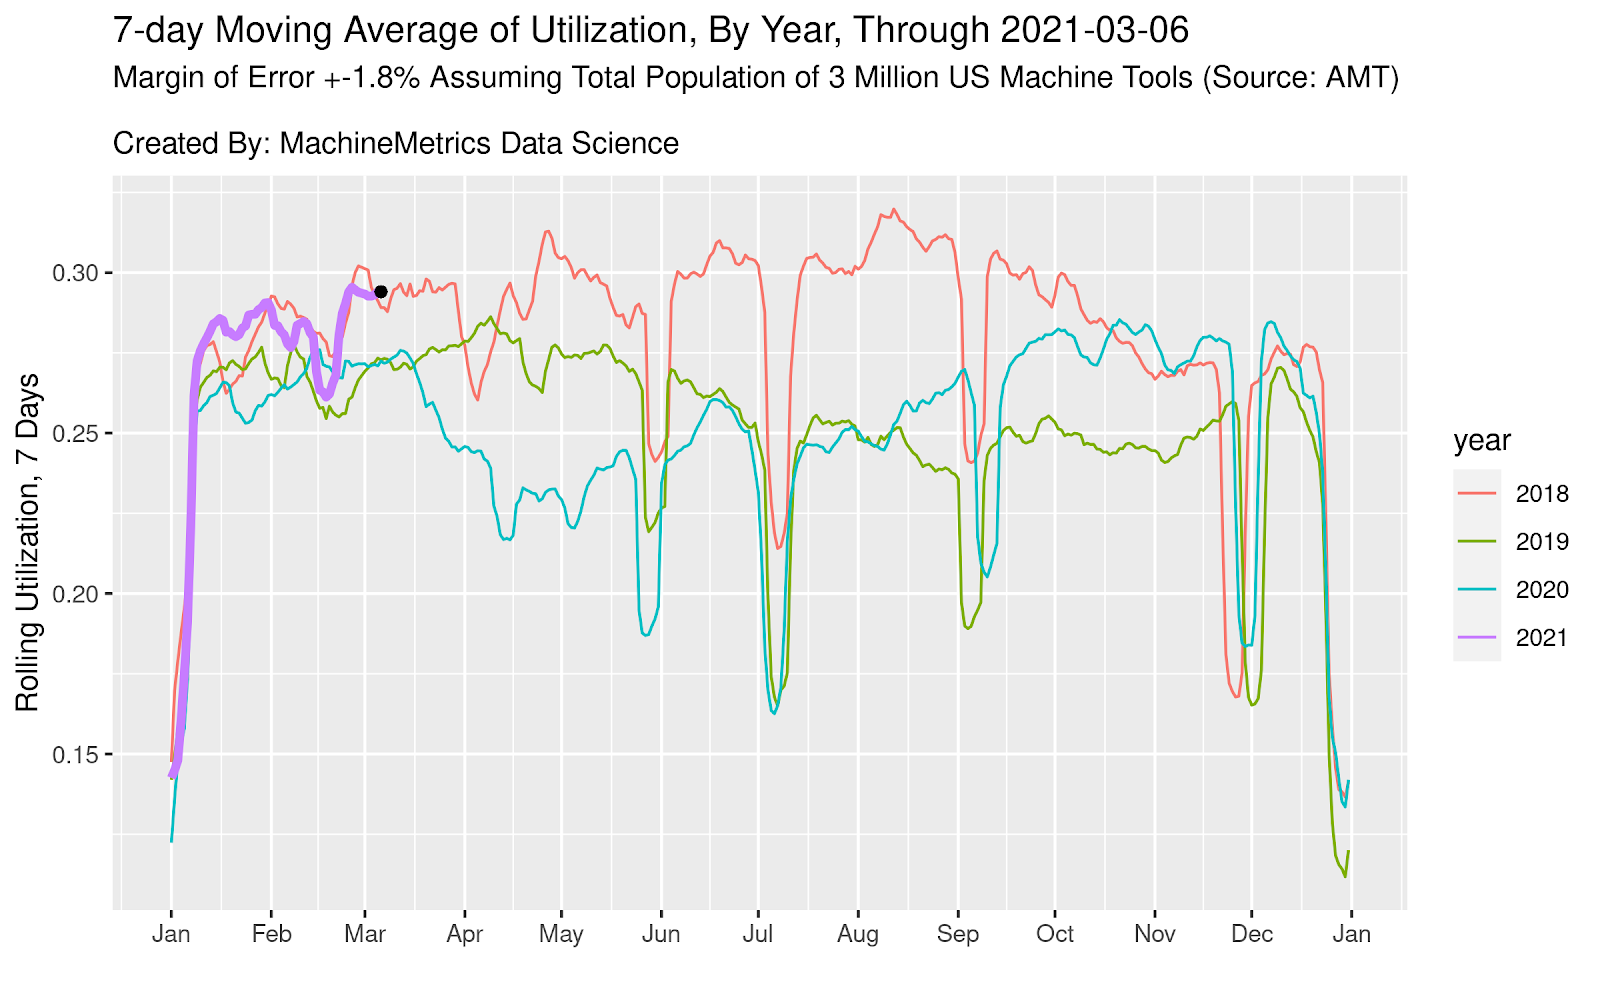
The larger the margin of error is, the less confidence users should have in the results of the survey. Our current margin of error hovers around +-1.6% to +-1.8%. That is, we are 95% confident that, for all 3 million machine tools in the US, actual utilization figures are +- 1.6% to +- 1.8% of what we report. Our last reported utilization figure for March 6th, 2021 was 29.41%, which means we believe that it is very likely actual utilization for the entire population of machine tools is between 27.60% and 31.21%. This means that comparisons that occur within the margin of error, just like poll results between two candidates that are within the margin of error, should be considered with a grain of salt, and approached with caution. I think we all learned this firsthand during the 2016 election cycle.
For example, if utilization changes from 29.0% to 29.4%, this is still within our margin of error and should be considered more of a curiosity than a fact. If, however, this change persists for many days and utilization changes from 29% to 31% within the span of a week, we are 95% confident that this reflects the population-level change. In another embodiment, if it’s the Friday before July 4th and utilization changes from 29% to 25% on a day-to-day basis, it is also more than just a curiosity that this happened, but rather that it is reflecting the reality on shop floors across the United States (that people take off the Friday before July 4th to start the weekend early).
The +-1.6% to 1.8% figure is also important in and of itself. This is the buffer you should set for yourself if you are benchmarking your own factory’s utilization against industry norms.
In the spirit of our clarification on margin of error, we would like to state utilization as follows:
We are 95% confident that the weekly rolling average of utilization through yesterday is between 27.60% and 31.21%, with a point estimate of 29.41%.
This reflects Fed economic data showing that factory demand across the country is surging due to pent up demand. We see that this is the highest March 6th utilization for the last four years, a pretty incredible insight.
This also represents a local maximum which has not been surpassed since October, 2018 (41-month high). This lines up almost perfectly with the ISM’s index of manufacturing, which also hit a 48-month high of 60.8 after jumping from 58.7 in January. The data is corroborated by anecdotal reports of a severe labor shortage in manufacturing, as factory owners struggle to hire workers amidst increased competition from Amazon et al. Shop floor managers are raising wages by as much as 30% in order to compete for talent, as new players move in to hire skilled workers.
We end by referencing a podcast in the Wall Street Journal which adds some human-context to what we’re seeing in our data: Where Jobs are Booming.
In conclusion, business is good, almost too good. Please stay tuned for further updates!
Ready to empower your shop floor?
Learn More

.png?width=1960&height=1300&name=01_comp_Downtime-%26-Quality_laptop%20(1).png)


.gif)


Comments