



For manufacturers operating multiple plants, getting real-time, apples-to-apples visibility is a major challenge. Each site often runs different systems, measures performance with different KPIs, or reports data inconsistently (and usually in a manual fashion).
This leaves operations leaders, VPs, and plant managers spending too much time piecing together spreadsheets, comparing outdated reports, and reacting to problems only after they’ve impacted throughput or delivery. It’s nearly impossible to spot underperforming plants, share best practices, or drive consistent improvement across sites.
MachineMetrics Enterprise Widgets solve this by giving you a real-time, standardized view of OEE, utilization, and other critical metrics - across every plant and machine. Instead of chasing down data, you get the clarity to benchmark sites, identify gaps, and take action faster.
The Problem with Multi-Site Visibility
Enterprise manufacturing leaders deal with challenges that go beyond the walls of a single plant:
- Metrics are inconsistent across locations
- Reports are manually created and often outdated
- KPIs aren’t standardized or comparable between sites
- There’s no fast way to see which plants are excelling or falling behind
Even companies that have invested in ERP and BI tools find themselves cobbling together spreadsheets just to get a weekly snapshot. That’s not scalable. And it’s definitely not real time.
Real-Time Enterprise Intelligence
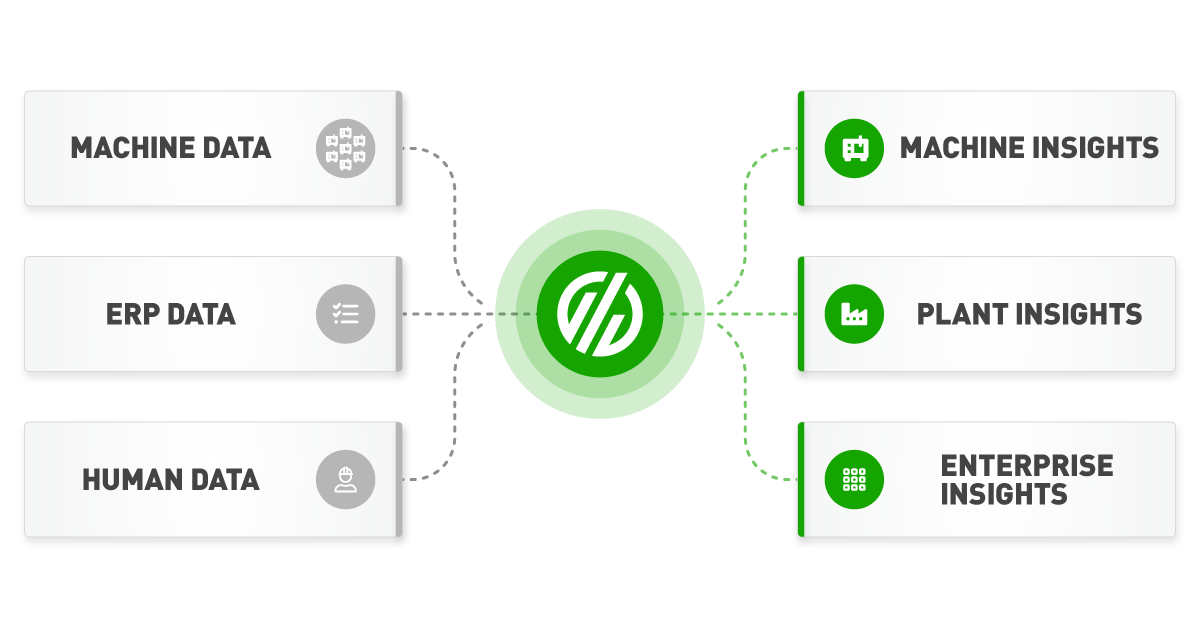
MachineMetrics Enterprise Widgets solve this with pre-built, configurable dashboards designed for multi-site operations. They turn siloed machine data into executive-level insights, updated in real time, and viewable from anywhere.
There are two powerful pre-built widgets available today, but don't let that stop you from using the MachineMetrics App Framework to develop new widgets.
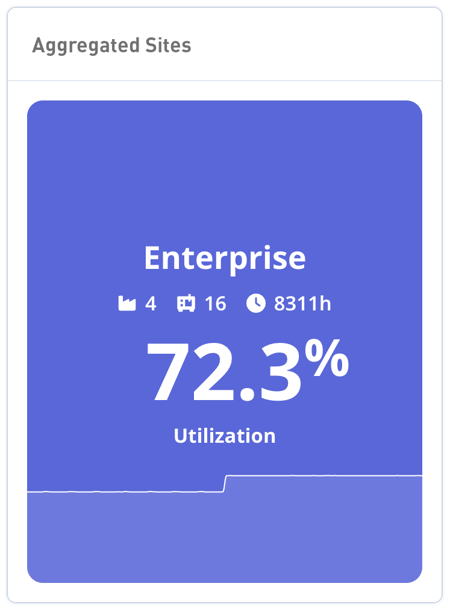
1. Multi-Plant Aggregation Widget
- Combines a key metric (like utilization) across multiple plants
- Shows total performance across your enterprise
- Drill down by plant, machine, or cell to diagnose specific issues
- Updates automatically as conditions change at each site
2. Multi-Plant Comparison Widget
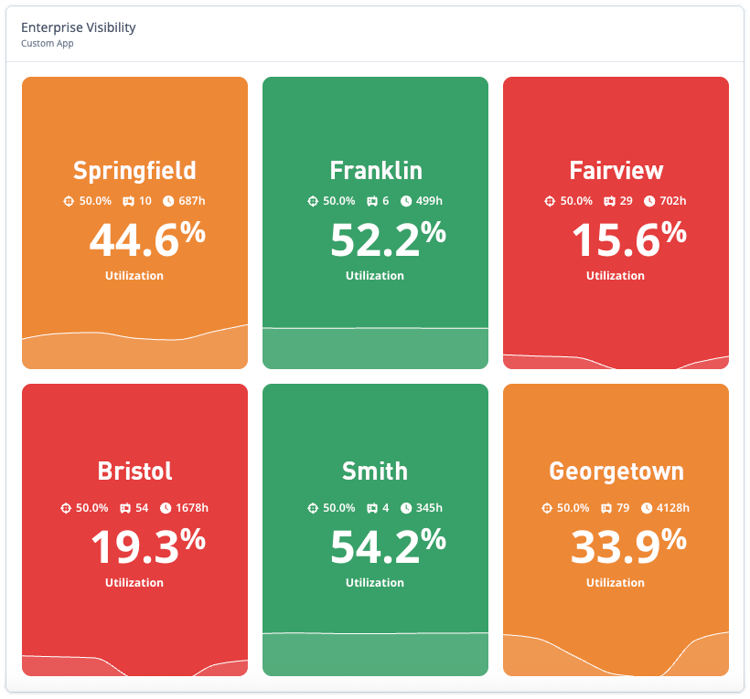
- Compares plants side-by-side across KPIs like OEE, Availability, Parts Goal, and Utilization
- Instantly reveals performance gaps or standout sites
- Click any plant to explore deeper metrics
- Ensures consistent measurement, regardless of local systems or workflows
Together, these widgets replace hours of manual reporting and make it easy to manage dozens of sites as if they were one.
Built for Enterprise Leaders
Enterprise Widgets are built to serve the visibility needs of every strategic stakeholder, offering a "single pane of glass" to monitor every plant at once, while identifying key issues and opportunities that can be acted on immediately.
Benchmarking
Executives, planners, engineers, and other staff require a global view of the company’s performance at a facility level. Machine analytics lets these stakeholders uncover deep operational insights from facility to facility.
These insights can be used to benchmark and compare performance across each plant and use the best results as a guide for implementing process improvement at other facilities.
Capacity Analysis
Machine analytics delivers the long-sought goal of unlocking hidden capacity. Analyzing the enterprise opens up significant machining and labor capacity for machines and product lines.
For example, if analytics indicate a constraint for a specific production line, work can be shifted to other locations with available capacity. Capacity analysis can lead to the deployment of new production optimization strategies and may also significantly impact capex planning.
Production Planning
With supply chains becoming more complex and volatile due to continuous disruption, planning teams need all the help they can get. Using machine insights to analyze enterprise-wide production helps these teams manage rapidly changing demand.
Because the platform delivers accurate and real-time machine data like part counts, cycle times, and other variables, planners can effectively plan labor, equipment, and materials at the right time.
From Fragmented to Unified
MachineMetrics Enterprise Widgets are the connective layer that turns machine and plant-level data into enterprise-level insights. Drive accountability, uncover opportunity, and lead with clarity across every facility you manage.
Learn more about unlocking enterprise visibility with multi-plant machine monitoring.
