
Book a Demo of MachineMetrics
The leading platform to collect, monitor, analyze, and drive action with machine data. Set up time with a product specialist to learn how we can help your operation.
Ready to empower your shop floor?
Learn More.svg)

Recently we have made several key updates to the Machine Timeline, one of the most commonly used features in MachineMetrics.
For those less familiar with the Machine Timeline, here is a quick primer on what the timeline is and its capabilities:
Timelines provide an interactive view for each machine showing changes in machine cycle status during a specified time range. MachineMetrics users can view machine faults and other events associated with changes in cycle status, view a table listing all downtime events, and analyze and categorize the reasons for downtime.
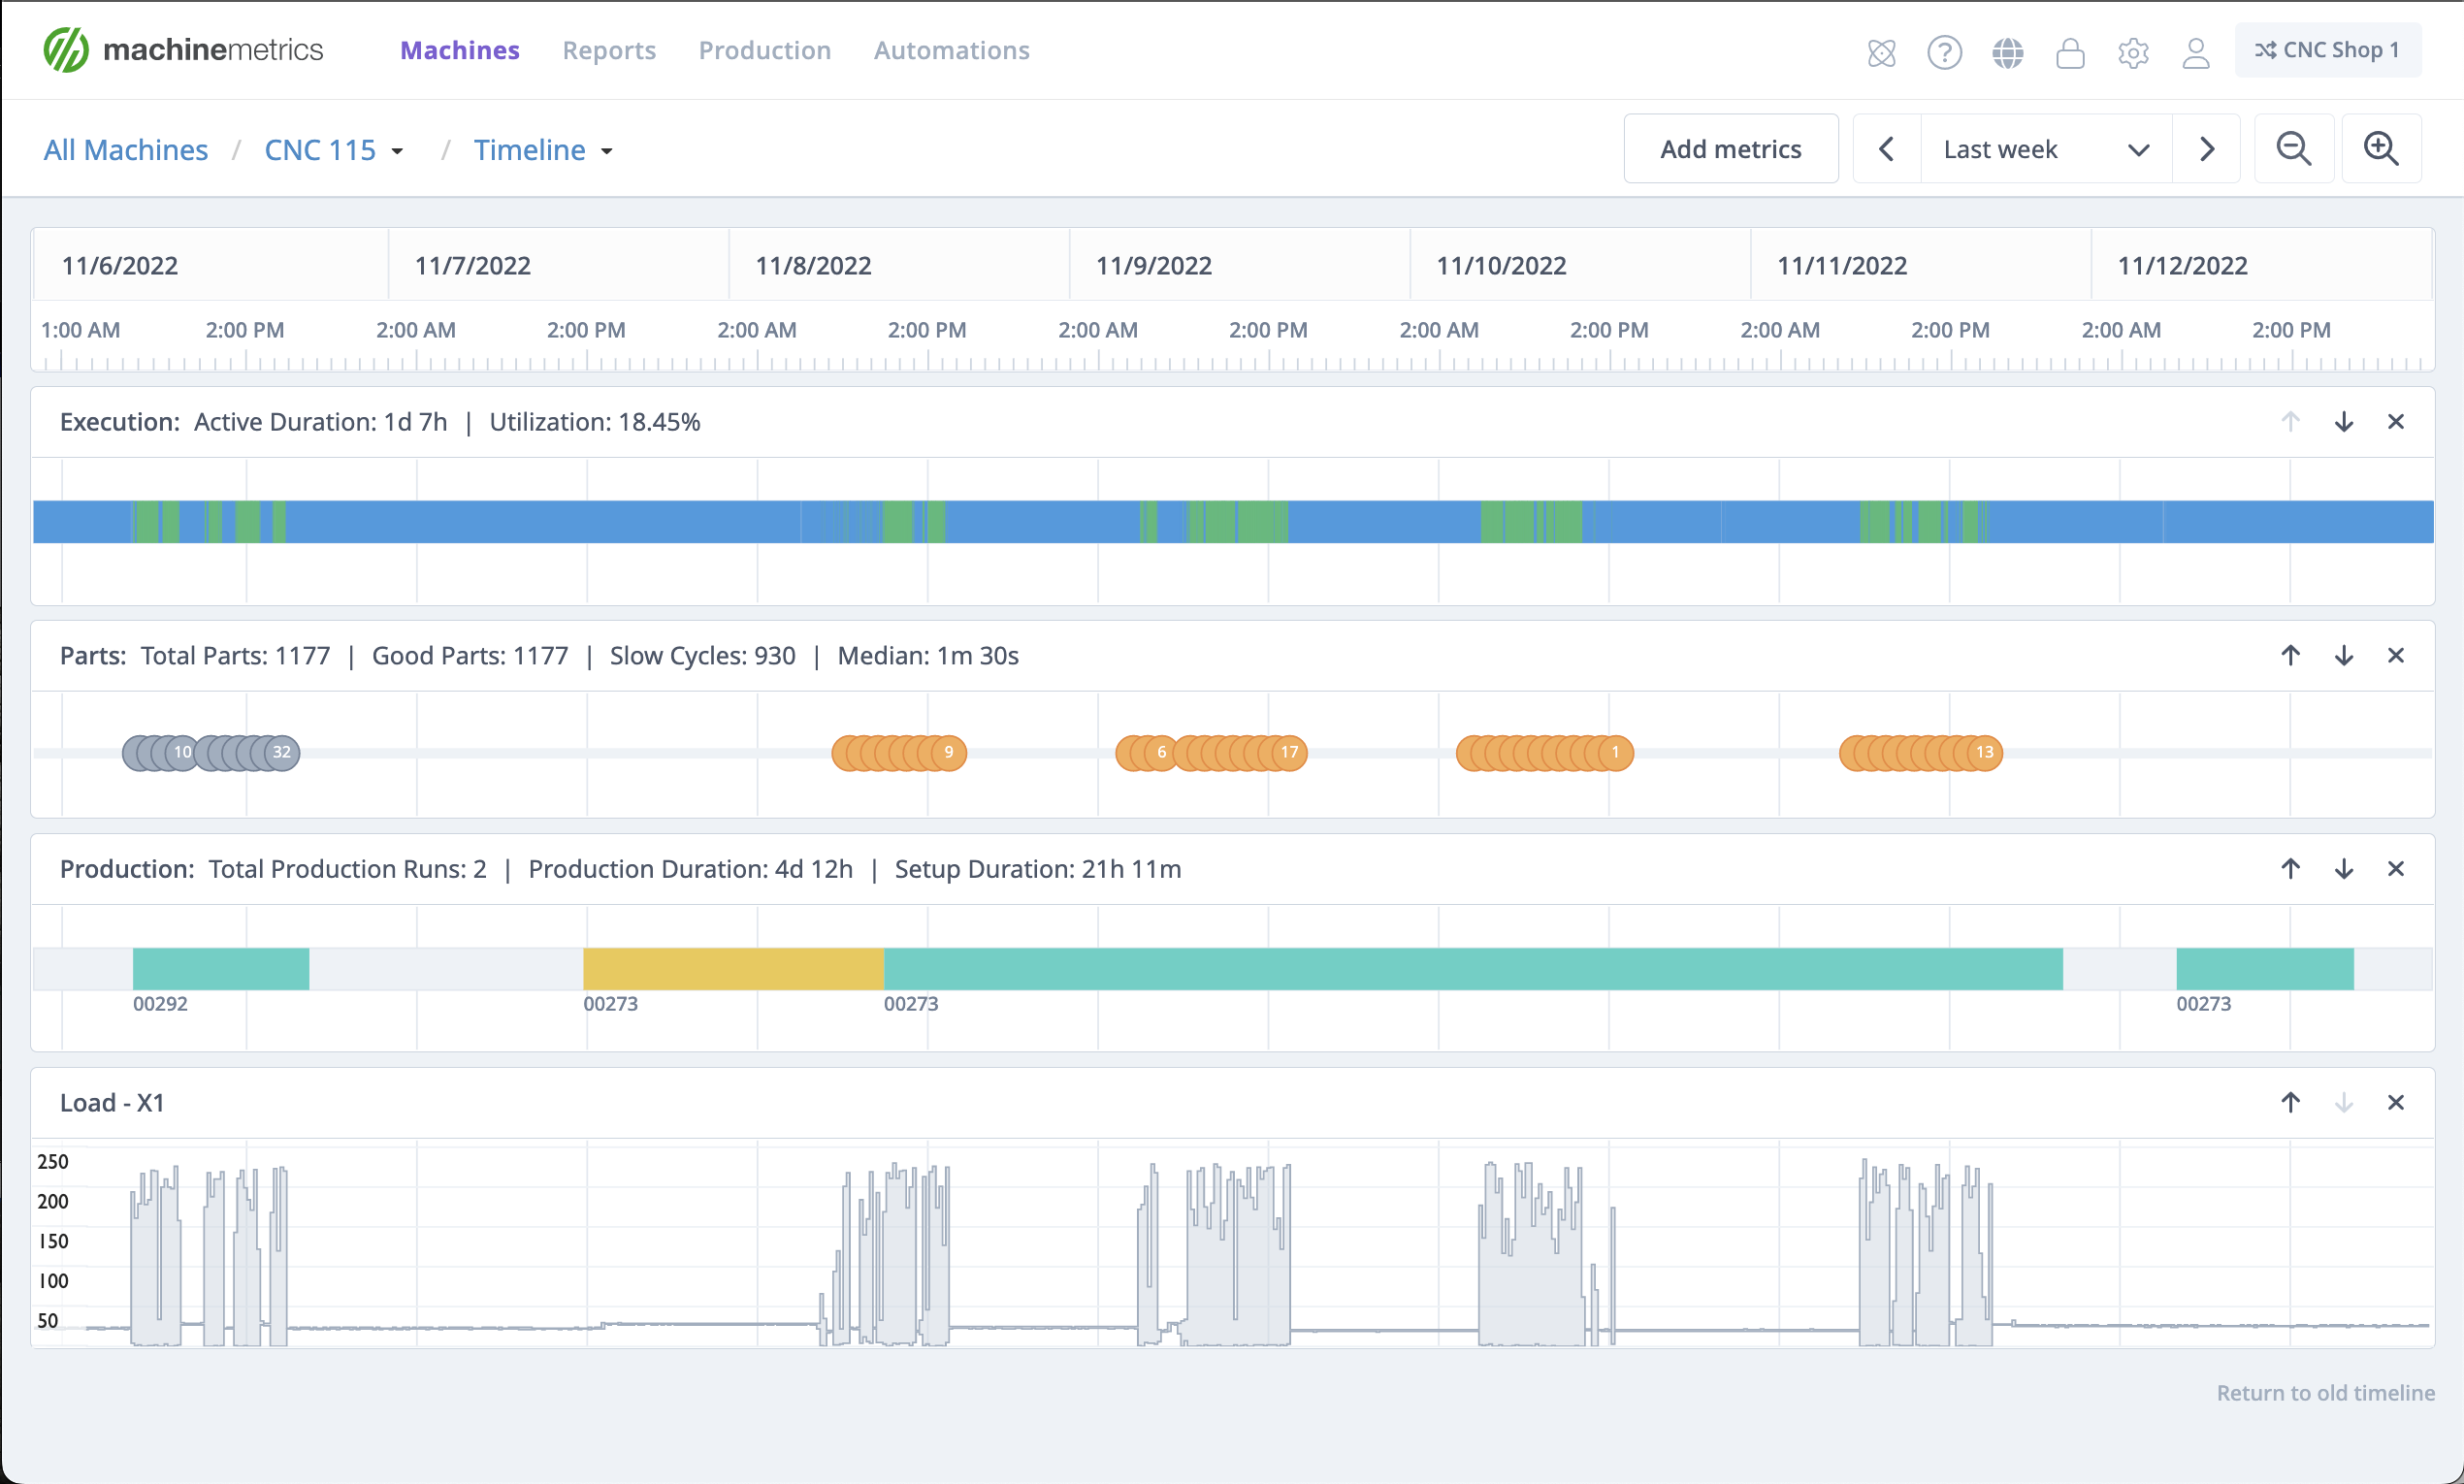
The new Machine Timeline shows the operating status over time for a machine and allows users to view and analyze operational data alongside diagnostic machine data with a configurable view. The new Timeline also provides actions for navigation, managing downtime, production runs, and more.
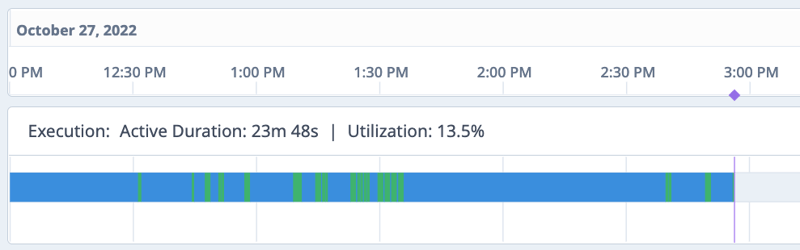
While dashboards and reports provide an overview of production, timelines drill deeper into the performance and health of equipment, enabling users to look back in time to see what happened to their machines and why, down to each and every minute.
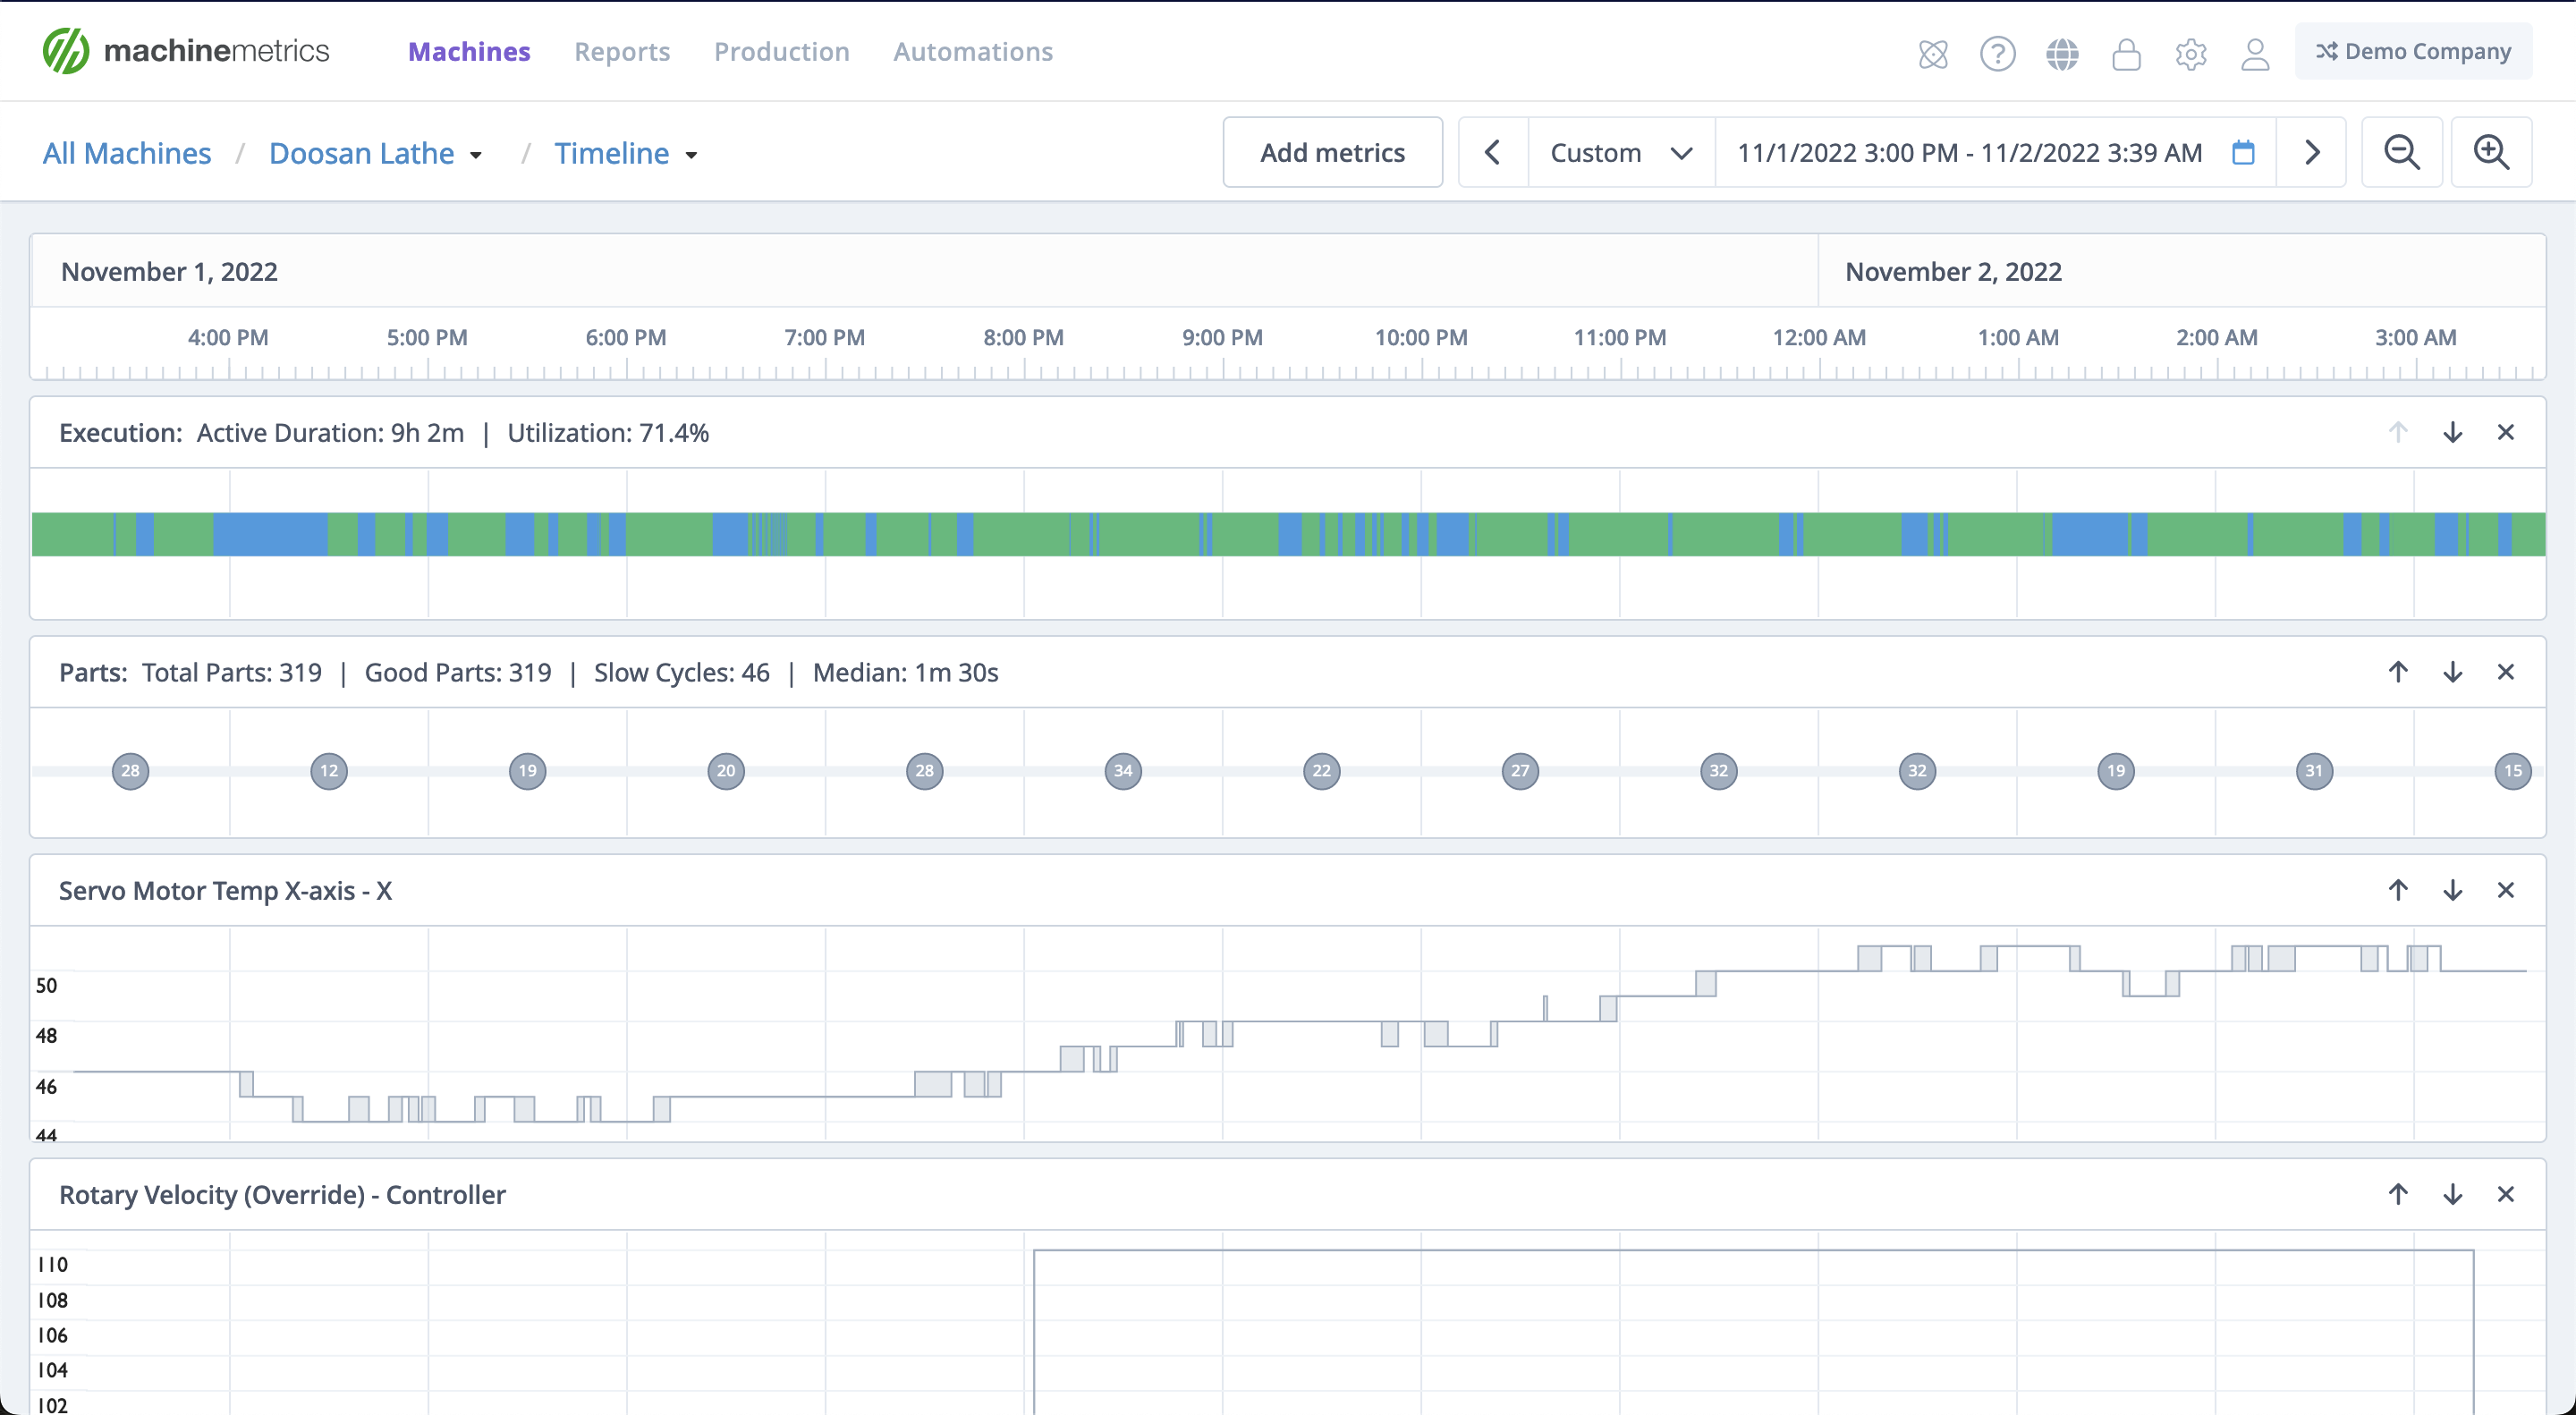
It’s an ideal solution for engaging in root cause analysis as users can review each individual machine’s timeline and analyze a variety of performance and diagnostic data points, including cycle times, utilization, downtimes, alarms, loads, feeds, and more.
We are excited to share several updates to our Timeline feature. These improvements expand on the existing functionality while providing a more complete interface to engage and analyze machine data.
What has this done for users?
Not only is it easier to navigate through machine timelines, but the ability to analyze and view data has been improved to ensure you have the data you want, in the format most helpful to you.
This puts power into the hands of engineers and managers searching for the “why” behind downtime events, extended cycle times, and any other issues occurring on the shop floor. In tandem with some of the recent production monitoring features we have released, this also continues to improve the relationship between what actually happened on the shop floor, and what is updated and accessible in management systems.
Recently a MachineMetrics customer sent us a story of how they had used the timeline to solve an issue they were experiencing. Below is the story from their perspective. Perhaps it will provide some inspiration for your team on how you can use the Machine Timeline.
Early in the afternoon, I got notified that a machine crashed and, as a result, required a Machine Incident Report to be completed. I went to the machine with the Plant Manager to take a look at what happened.
We arrived at the machine and the operator immediately said, “I have no idea what happened, I just pushed the button.” The operator was slightly inexperienced with CNC machines and explained to us how he was having issues with the roughing inserts wearing out too quickly, resulting in quality issues.
After a few questions, he said, “Tom was just over here looking at the speeds and feeds for the roughing tool and he made some changes.” We realized that the machine had crashed on the next part after the changes were made. We asked Tom, a manufacturing engineer, a few questions and examined the program but everything looked correct. There was no program error that would have caused the machine turret to crash into the spindle.
After some more investigation, I decided to log into MachineMetrics and see if there was any information I could gather about what happened on the machine. I navigated to the Timeline in order to pinpoint when the machine had crashed. I decided there were a couple of paths I could take to find the information I was looking for.
I navigated to the Diagnostic Timeline and added a few data items (Path:Block, Path:ControllerMode, Path:Execution, Path:Tool Number, Path:Tool). I also exported these data times for the 1-hour window when the crash occurred. After finding the time period the machine crashed in the diagnostic data I began to see the story.
The machine completed running a part and then was put into EDIT mode on the control. This was the point when the operator went to find the manufacturing engineer to ask about the roughing insert’s tool life.
I also noticed that the line of code in the program was changed from “G96 S450” to “G96 S350”. Nothing wrong so far. Continuing, I then noticed that the machine returned to AUTOMATIC mode on the control before a short 2-3 minute gap in time.
At the end of the idle period the machine went ACTIVE and displayed T1010 as the active tool number but the machine turret had T5 in the active position when it crashed. I also noticed that the first block of code that ran when the operator started the machine was the “G96 S350” line.
From the data, I could see that the machine then alarmed out when it crashed into the spindle after entering its first G0 rapid line. So what happened? The program was never reset which caused the wrong tool offset value to be active for the wrong tool resulting in an extremely costly machine crash.
The new Timeline provides the tools necessary for this level of investigation without the need to export data to external systems and provides immense value for users performing root cause analysis.
Summary:
*Actual events that occured
Ready to empower your shop floor?
Learn More

.png?width=1960&height=1300&name=01_comp_Downtime-%26-Quality_laptop%20(1).png)


.gif)


Comments