Manufacturing leaders don’t just need data - they need the right data, delivered in the right way, at the right time. Operators want clarity on performance targets. Engineers need visibility into cycle time trends. Executives want to tie shop floor data to the bottom line. And continuous improvement teams require evidence to drive change.
MachineMetrics’ Report Builder and Custom Dashboards are designed to meet these exact needs - without forcing teams to manual collect, compile, and run reports in Excel. As part of the MachineMetrics App Framework—and powered by a unified data model that blends machine, operator, and ERP data—these tools make it easy to build, customize, and embed reporting applications that match the unique needs of any team or initiative.
Rather than relying on static dashboards or delayed ERP reports, users can create dynamic views of real-time production data that drive decisions. From shift-level drilldowns to company-wide rollups, the flexibility of Report Builder and Custom Dashboards ensures every stakeholder can access—and act on—the insights that matter most.
Build the Report You Actually Need
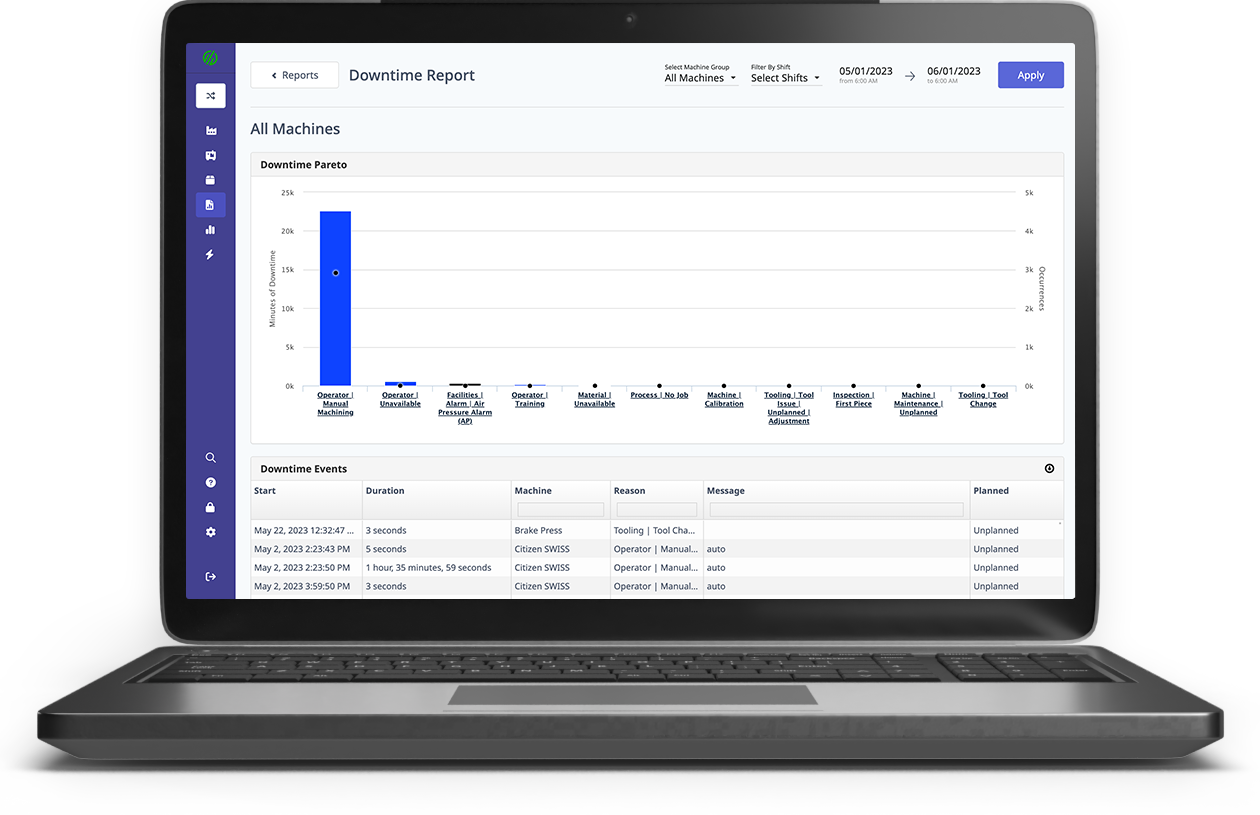
MachineMetrics’ Report Builder lets users slice and dice data exactly how they want. Filter by machine, shift, operator, job, part number, time period, or dozens of other attributes. Need to know which job had the highest downtime last week? Or how cycle times for a specific part number have shifted month over month? You can build that.
Users can select and group data by any metric, apply time filters, and even compare multiple time frames to track trends. These reports can be saved, shared, exported to CSV, or turned into visual charts for executive presentation. No more digging through spreadsheets or waiting on custom SQL queries—Report Builder puts analysis in the hands of the people who need it.
Users can zoom in on a part number, filter by machine or shift, and identify the specific factors affecting cycle time and performance. That’s the power of getting native, real-time data directly from machines.
In the below video, MachineMetrics Applications Engineer Vicente Martinez demonstrates the ease of creating customized reports that cater to specific business needs
Turn Reports Into Real-Time Dashboards
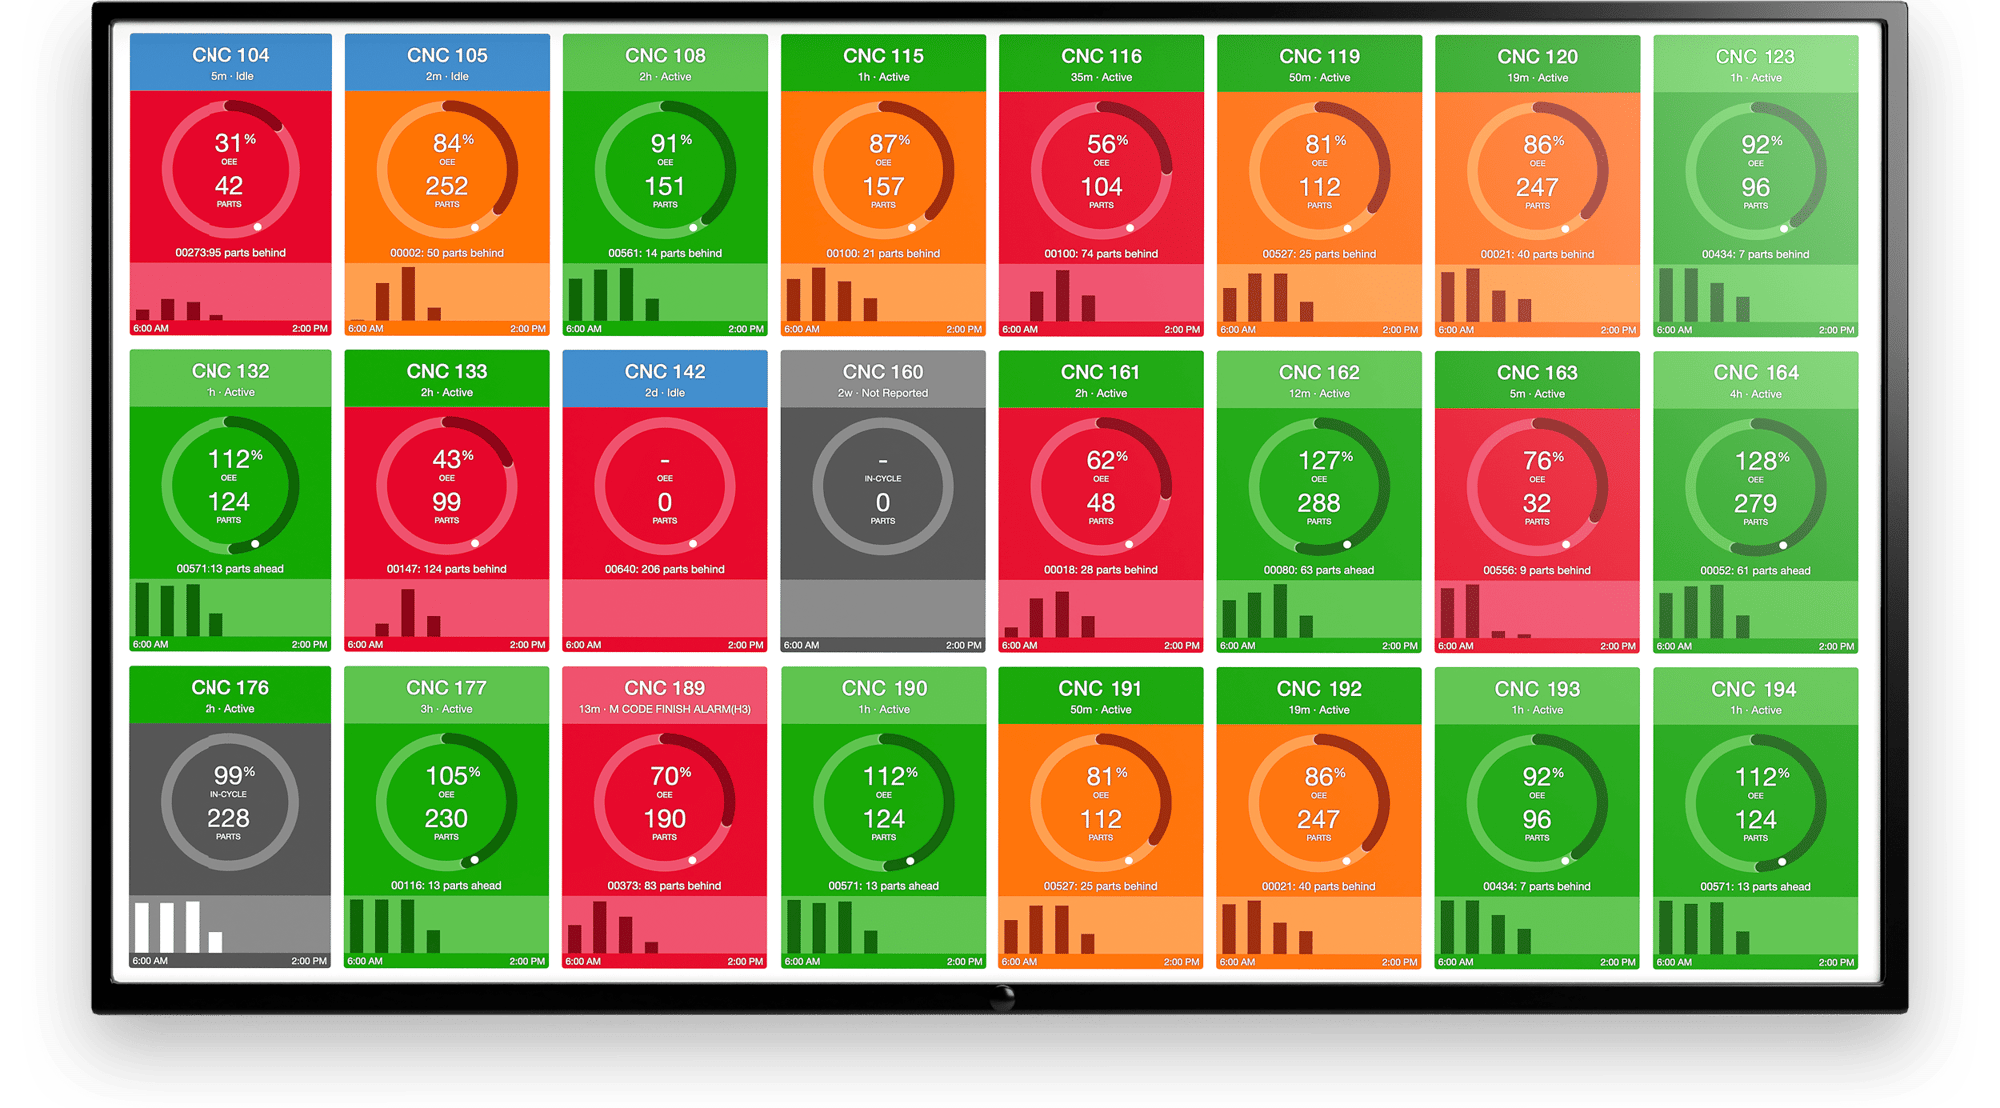
Once the right reports are built, they can be added to a custom dashboard using MachineMetrics’ Custom Dashboards feature. Dashboards serve as the dynamic visualization layer for your most important KPIs and reports. Want to see utilization, OEE, downtime reasons, and cycle time variance across your top machines—all on one screen? You can build that.
Users can mix and match widgets—KPI matrices, donut charts, time series charts, and custom reports—to tell a complete story. Want to compare parts produced this week versus last? Or track performance against a baseline? It’s all possible with a few clicks.
Custom Dashboards can be filtered globally (e.g. month-to-date) or widget-by-widget, and users can choose to make dashboards public or private. They can also be bookmarked or shared as a quick access link, making it easier than ever for teams to rally around the same data.
From Weekly Reports to Continuous Improvement
MachineMetrics' Report Builder and Custom Dashboards give manufacturers the tools to drive proactive, ongoing improvement. Rather than relying on end-of-week exports or monthly reviews, teams now have access to live data that surfaces hidden inefficiencies and enables immediate action.
Production teams can explore cycle time deviations, investigate downtime trends, and understand throughput variance without needing support from data analysts - and without needed to export data to Excel. Once configured, reports and dashboards become a daily reference point—whether it's a plant manager checking in on weekly KPIs or an engineer testing the impact of a process change.
.png?width=1960&height=1300&name=01_comp_Downtime-%26-Quality_laptop%20(1).png)


.gif)


Comments