
Book a Demo of MachineMetrics
The leading platform to collect, monitor, analyze, and drive action with machine data. Set up time with a product specialist to learn how we can help your operation.
Ready to empower your shop floor?
Learn More.svg)

In Part 2, we'll discuss tracking quality in MachineMetrics.

Vilfredo Pareto
CC BY-SA 3.0
Usually it's the squeaky wheel that gets the grease, however the squeaky wheel isn't always the source of the problem. A Pareto chart is a graphical tool that allows manufacturers to identify the most significant problems across the shop floor using quantifiable data. It often identifies the top few issues that cause 80% of the pain. Continuous Improvement leaders use these charts to focus on the group of problems causing the most machine downtime or quality issues. Vilfredo Pareto, an Italian economist, developed the Pareto Principle, also knows as the 80-20 rule. which means that 80% of the effects come from 20% of the causes. These charts are simple to read and useful, however can be very difficult to produce the data.

Unplanned Downtime Pareto from MachineMetrics
 Unplanned Downtime Pareto from MachineMetrics
The unplanned downtime Pareto is difficult to produce. It requires understanding all downtime that occurs on a machine. Traditionally, obtaining the necessary data involves log sheets that require the operator to manually log all significant downtime. This manual approach will likely miss frequent downtime events that are only a few minutes each, but add up to a significant amount of time. Typically the actual data is logged well after the incident occurs, so the time is not very accurate. A machine monitoring system that tracks the cycle status of a machine in real-time is necessary to generate data for a downtime Pareto. It's also necessary for the operator to categorize each downtime event into reasonable buckets during or shortly after an event.
Common categories of unplanned downtime include excessive tool changeover, excessive job changeover, lack of operator, and unplanned machine maintenance.
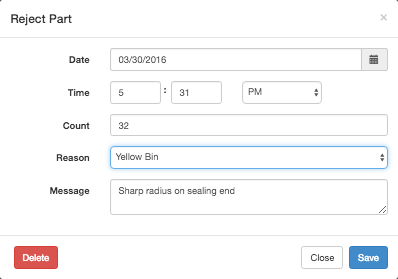
MachineMetrics was designed to give operators an easy tablet or web interface that prompts the operator when the machine goes down to categorize downtime. All the operator has to do is tap the screen for a reason, and move on. When the machine first goes down, the operator is prompted to enter the reason, but it's optional an unobtrusive. It looks like this and requires one tap to show the options, and a second tap to select the reason. Once the downtime exceeds 5 minutes, the options appear over the rest of the view, encouraging the operator to enter a reason.

Operator View once downtime first occurs

Operator View after downtime exceeds 5 minutes
For some downtime events, such as a setup that has taken too long or a tool change that occurs during or near the time the machine reports a tool life warning, MachineMetrics will automatically categorize downtime and operator input is not required.

Ready to empower your shop floor?
Learn More

.png?width=1960&height=1300&name=01_comp_Downtime-%26-Quality_laptop%20(1).png)


.gif)


Comments