Meet Your New Morning Teammate: AI Summary for the Daily Production Dashboard!
%20(1).gif?width=1280&height=720&name=MachineMetrics%20_%20Daily%20Production%20(1)%20(1).gif)
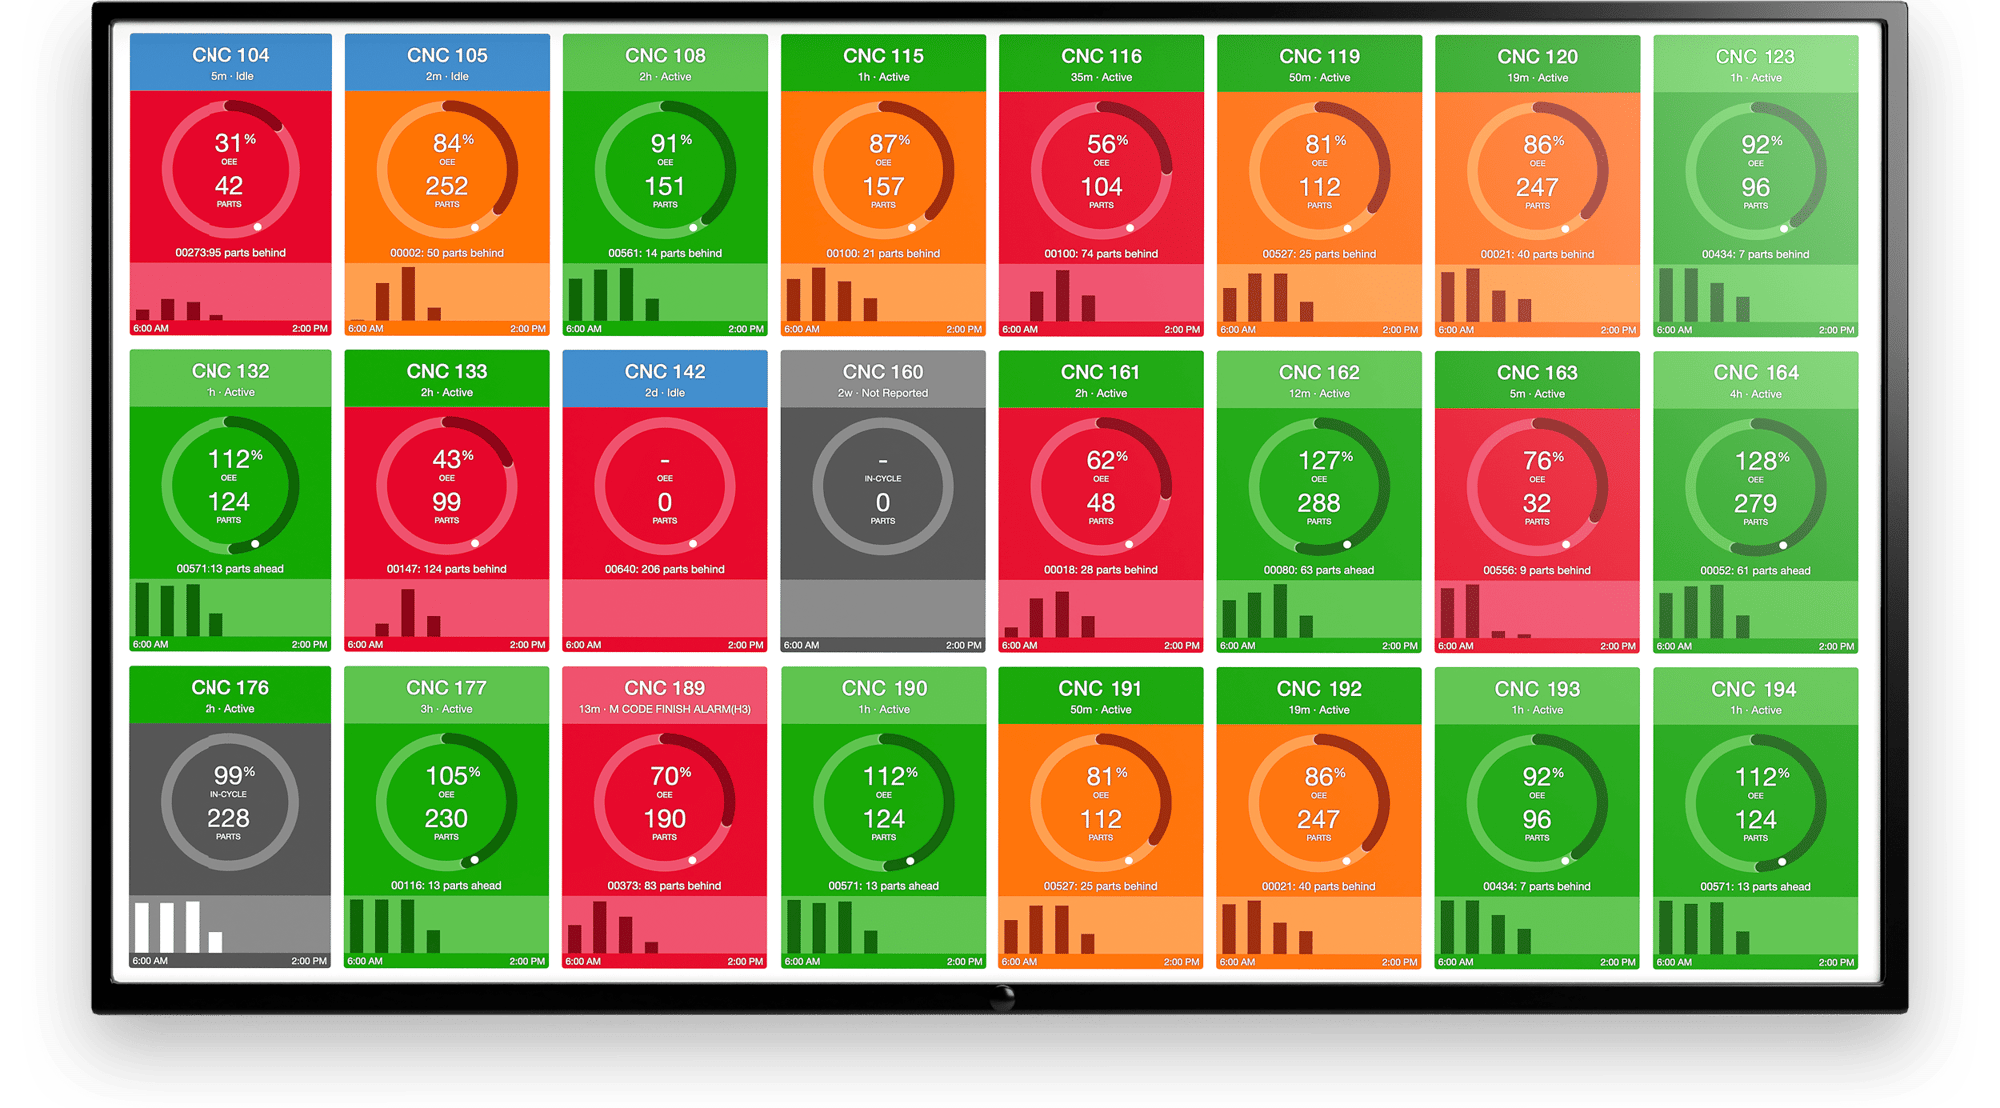
Every day, production leaders across the shop floor start their morning the same way: open the Daily Production Dashboard, scan dozens of machines, and try to figure out what happened yesterday—and what needs attention today. With 80+ machines, each with their own utilization, part counts, cycle times, downtime reasons, and timelines, that’s a lot to digest before your first cup of coffee.
So we built something to do that work for you.
✨ Introducing AI Summary
The new AI Summary panel is now live in the MachineMetrics Daily Production Dashboard—and it’s here to help you start smarter.
Instead of scanning rows and comparing metrics manually, the AI Summary gives you an instant narrative of your factory’s performance, drawn directly from the data already visible in your dashboard.
Here’s what you’ll see:
-
The Headline: A top-line insight like “OEE improved 8.4pp, driven by performance gains on your lathes despite increased downtime on mills.”
-
The Issues: Critical anomalies like “VMC-04 availability dropped 30pp yesterday—emergency stop alarms triggered twice, 5+ hours of downtime.”
-
Data Integrity Flags: Potential reporting concerns like “HMC-12 had 1,684 manual part corrections—your automatic counter may need calibration.”
-
Quality Exceptions: Subtle quality hits like “Lathe-07 quality dropped to 99.84% with 2 rejects on the current job.”
These insights are organized into four tabs: Issues, Highlights, Standards, and Recommendations, so you can jump straight to what matters most.
🧩 Why This Matters
Real-time data is valuable—but only if you can interpret it fast enough to act. The AI Summary flips the script: you don’t pull insights from the data, the data delivers insights to you.
This is part of a broader shift we’re driving at MachineMetrics—from “here’s your data, good luck” to “here’s what your data is telling you.”
🔜 Coming Soon: Max AI Integration
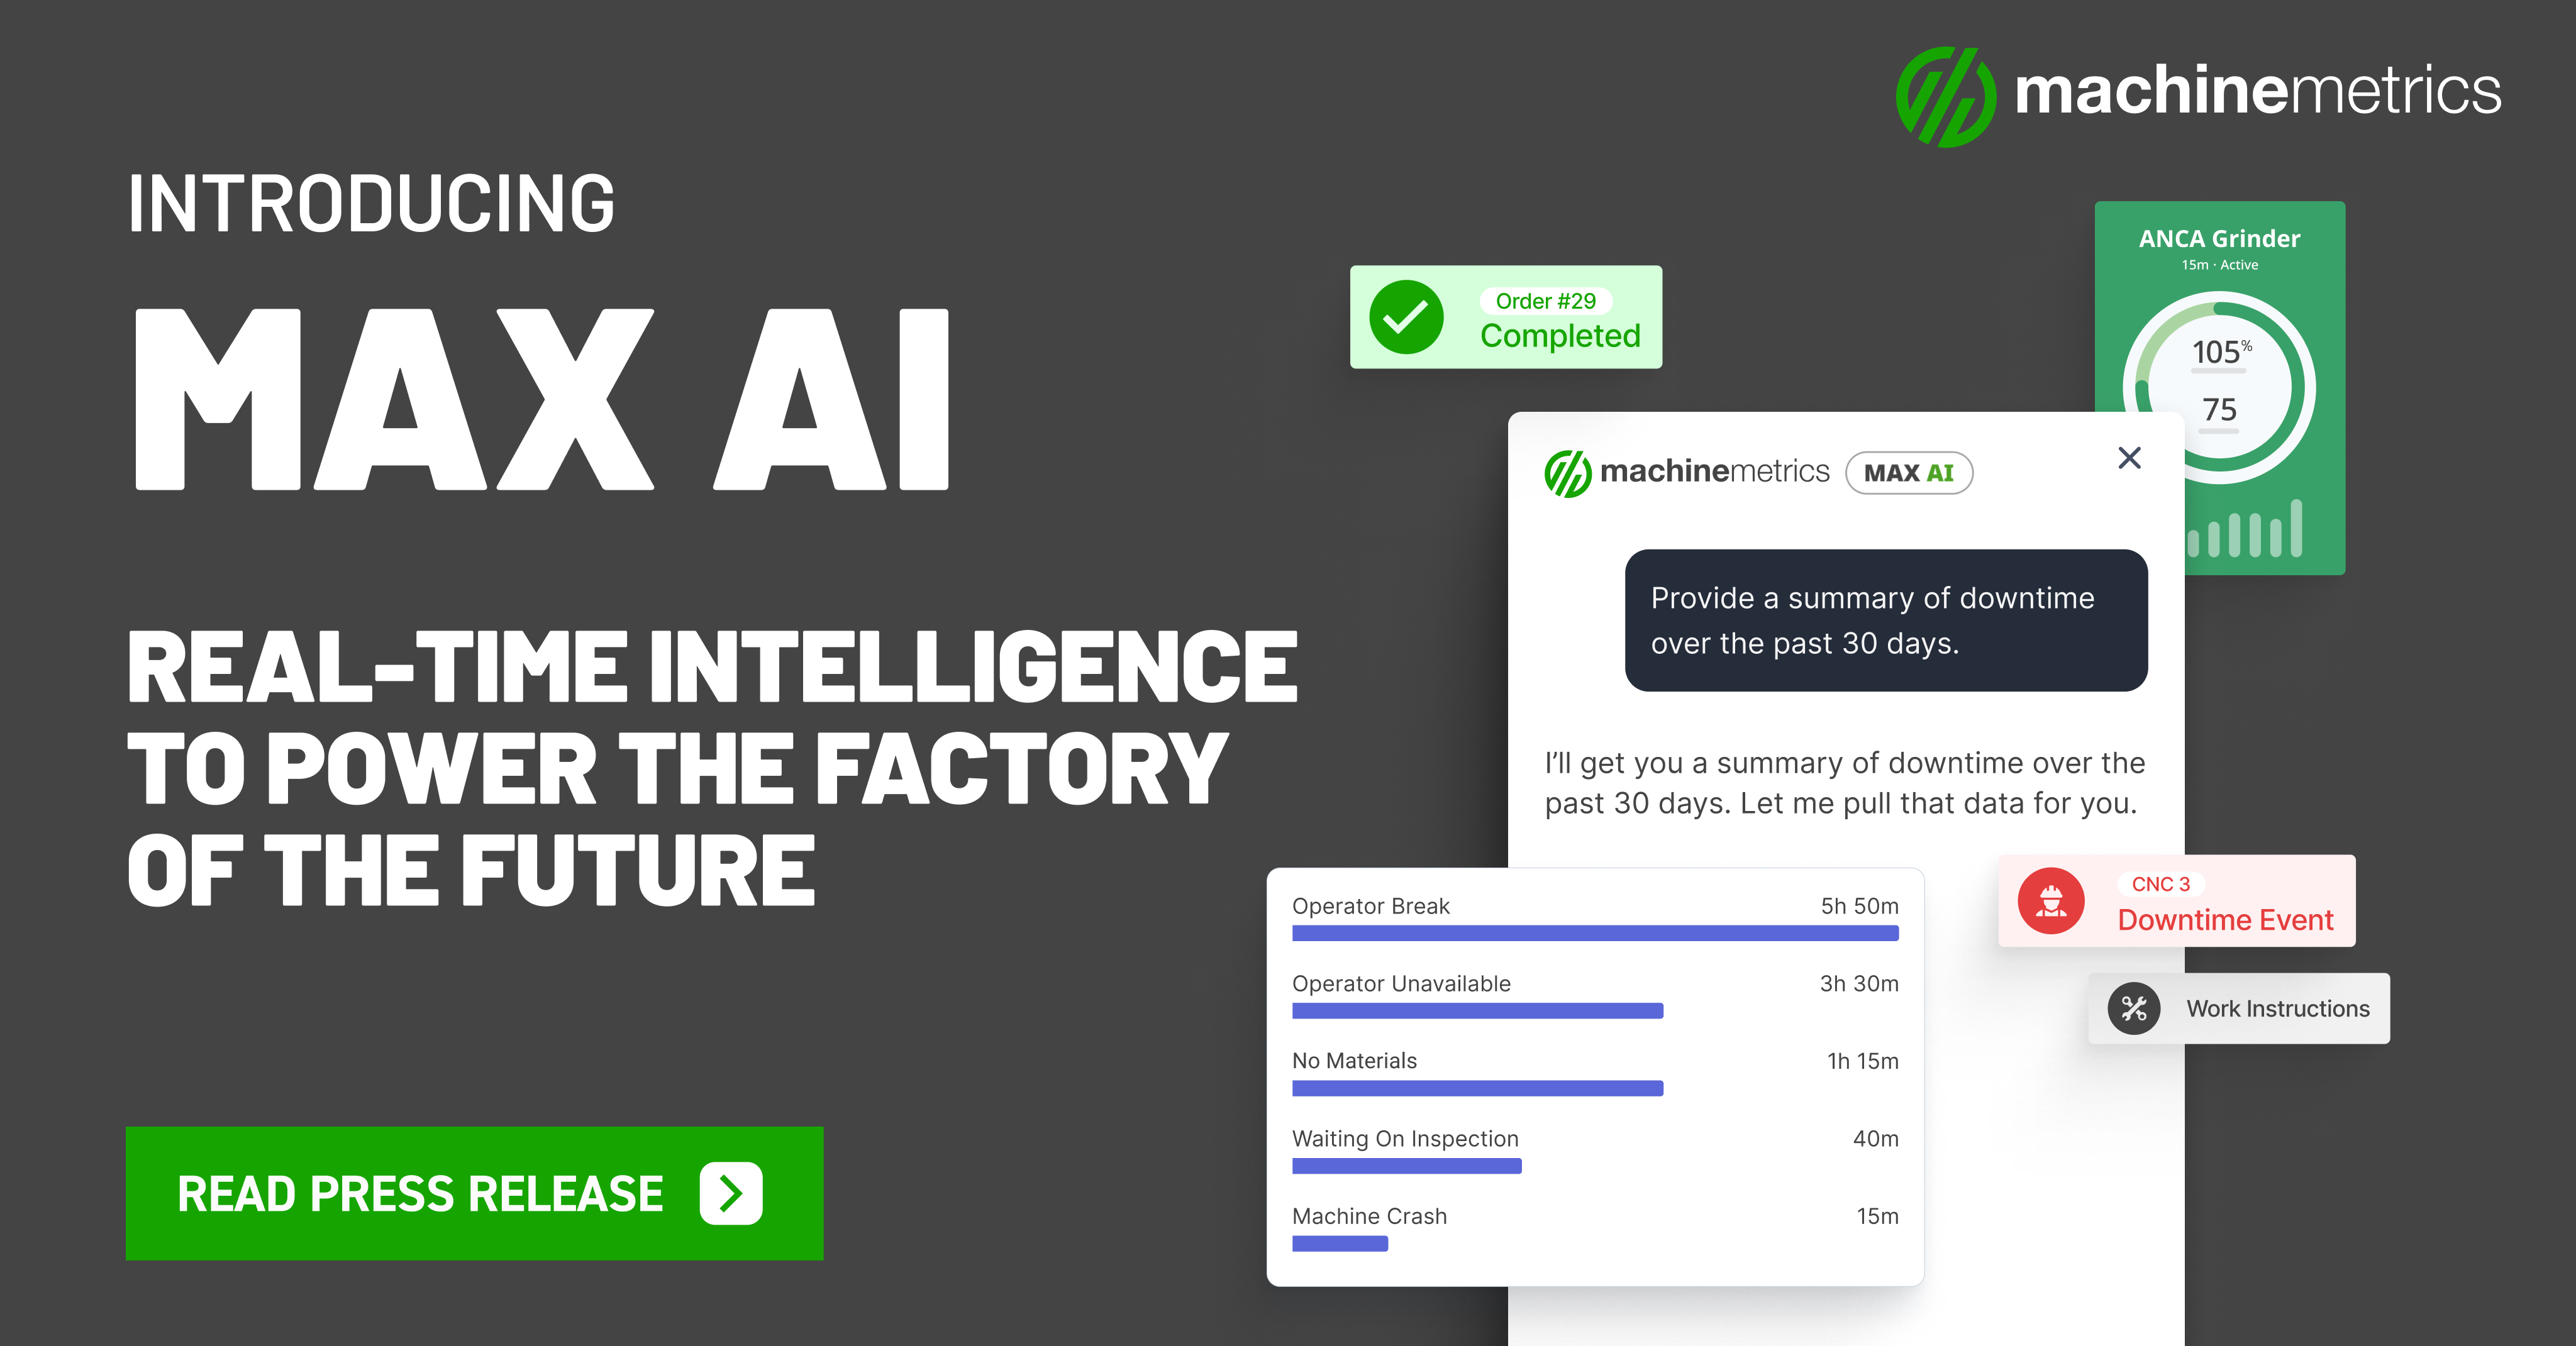
In early Q1, AI Summary will connect directly with Max AI, our intelligent digital assistant. That means you’ll soon be able to ask questions like:
-
“Why did VMC-04 have so many emergency stops?”
-
“Which machines had the biggest quality issues yesterday?”
-
“What’s the biggest cause of underperformance in Cell A?”
You’ll even be able to listen to an audio summary of your day while you walk the floor.
✅ Getting Started
AI Summary is available now—just open the Daily Production Dashboard and click the ✨ icon to generate your analysis. First-time generation takes about 1–2 minutes.
Need a refresher on the Dashboard itself? Here’s what it can do:
-
Filter by date, shift, machine, or machine group
-
Sort any column, hover for more details
-
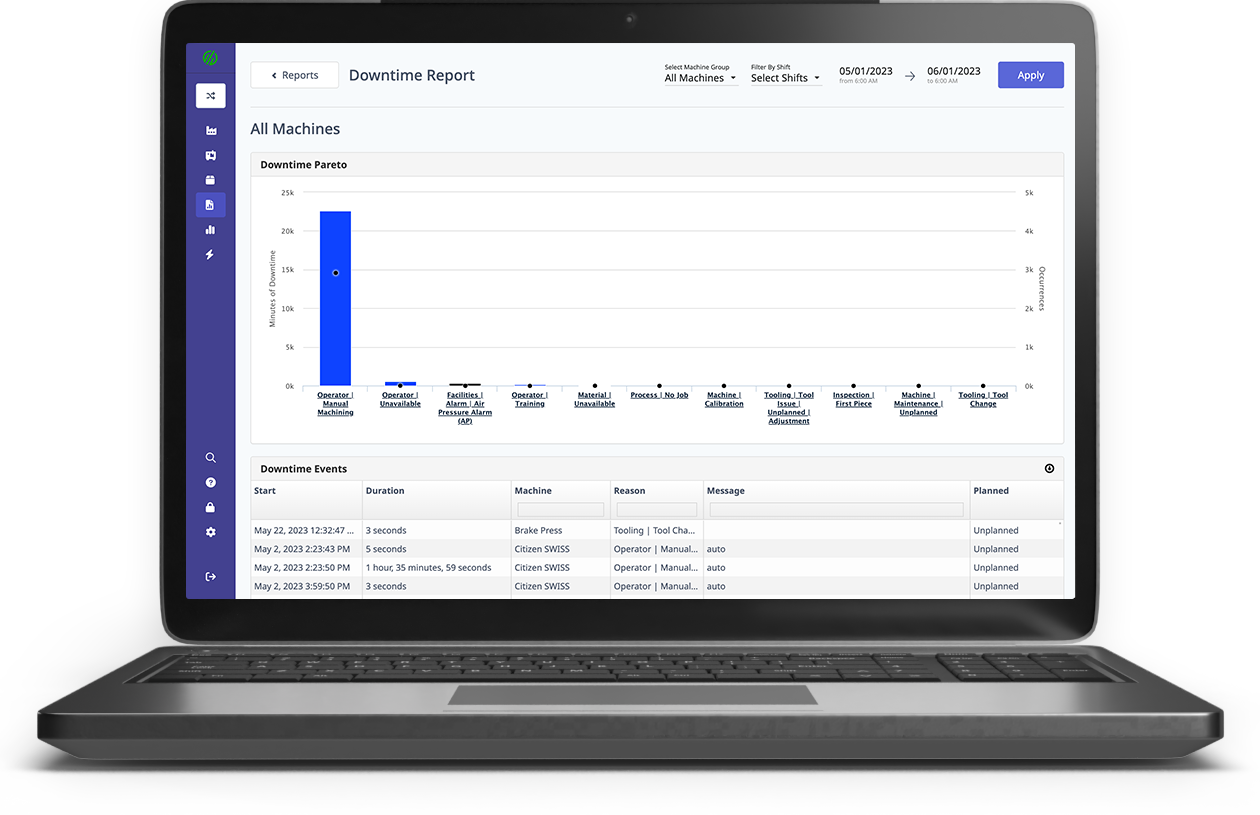
Drill into cycle time, setup time, touch time, and execution timelines
-
Track performance vs. engineered standards and historical baselines
-
Use shift-based views to run better daily huddles
For best results, start with a clear scope (e.g., a single department or shift), hide unused columns, and use the AI Summary “Issues” tab to guide your next production meeting.
🏁 Let's wrap this up
Whether you're running your daily huddle, analyzing performance trends, or troubleshooting production issues, the new AI Summary helps you focus faster.
Open your dashboard. Click the sparkles. Get the story. Get moving.
WATCH THE VIDEO NOW TO SEE IT IN ACTION
.png?width=1960&height=1300&name=01_comp_Downtime-%26-Quality_laptop%20(1).png)
%20(1).gif?width=1280&height=720&name=MachineMetrics%20_%20Daily%20Production%20(1)%20(1).gif)

Comments