
Book a Demo of MachineMetrics
The leading platform to collect, monitor, analyze, and drive action with machine data. Set up time with a product specialist to learn how we can help your operation.
Ready to empower your shop floor?
Learn More.svg)

Manufacturing can be a chaotic, fast-paced, and complex endeavor, forcing manufacturers to not only identify but also solve unique challenges. These problems can slow production, creating bottlenecks or stoppages when they are least expected. When such problems arise, many turn to root cause analysis (RCA) to help implement a solution.
Root cause analysis, or RCA, is a specific process that recognizes that disruptions and problems can be traced to a particular cause and that a solution to rectify that cause will echo down the chain and result in an improved state. RCA attempts to identify the cause of defects and problems rather than simply treating symptoms or "putting out fires."
Root cause analysis is recognized as a critical component in both the lean manufacturing methodology and Six Sigma. It optimizes the time required to drill down to the cause of a problem and provides a structure for problem-solving within manufacturing.
Benefits of root cause analysis include:
| RCA Case Study: Avalign Technologies leveraged equipment data to accurately track OEE and machine downtime. This enabled their OEE Director to resolve process bottlenecks and increase capacity by millions. Read the full story. |
The root cause analysis approach will differ from company to company as well as from problem to problem. It may zero in on machine-specific issues across a specific OEM's machine type. It may also be used for bottleneck analysis between departments. Or it may be used to address factory-wide defects within an enterprise.
Generally, there are six steps involved in root cause analysis:
The first step is the most critical. All team members must understand the issue. It must be stated objectively. And it requires clarifying questions to determine that it is indeed an urgent problem or bottleneck. This is the broadest stage and is a general problem statement such as a defect rate, bottleneck, or missed shipment.
Data collection is crucial in root cause analysis. Here, team members attempt to list as many causal elements as possible. Everything is on the table, and the list can be broad and detailed. Today, it is easier to locate and leverage data in root cause analysis because many OEM equipment manufacturers embed data collection in their machines. It may also be the case that a factory has deployed data collection devices for those machines that do not contain it natively.

It is common to confuse symptoms with causes. Some tools and methods can help in drilling down to separate the symptoms from the causes. The assumption is that if the causes can be determined and corrected, the symptoms will cease to exist. Here, data collection can also be critical as many data collection systems have analytics capable of determining categories of problems.
Once the root cause is determined, an effective solution can be crafted. This may include training, mechanical modification, floor layout, or more robust data collection and analytical capabilities. Often, data can assist in crafting corrective action. By having real-time data and insights in hand when the root cause is determined, managers can create a relevant, real-world solution based on actual data.
Once the root cause is established, and the corrective action identified, the team must implement the solution. This means revising or replacing old SOPs, creating new workflows, and auditing the results. The deeper the data collection capability, the greater the analysis' impact on the chosen solution. It may even be possible to program autonomous or semi-autonomous action by the machines to help implement or monitor the solution's progress or affect its growth.
No solution lasts long without an audit process. This audit piece must validate the effectiveness of the solution. This is made more accessible when data collection is robust and subjected to real-time analysis. By doing so, the validity of the solution can be monitored or adjusted to improve effectiveness. And if the answer is a success, the root cause may be transferable to other processes and departments within the company.
Root cause analysis can be undertaken by a team manually. But when it is combined with advanced data collection and analysis, it both speeds and enhances the impact. Solutions can be rolled out to other factories and other departments experiencing similar problems, and it can improve production efficiency and reduce defects in production.
For companies undertaking root cause analysis, there are many tools and methodologies available to use. We provide a brief overview of many of these strategies below:
One of the most straightforward root cause analysis tools is also one of the most effective. Simply asking "why" five times can help drill down to the cause. It forces deeper and more critical thinking until all excuses have been exhausted. Realistically, it may take slightly more or less than five, but the methodology is that the final answer can be revealed by asking why until all solutions are adopted.
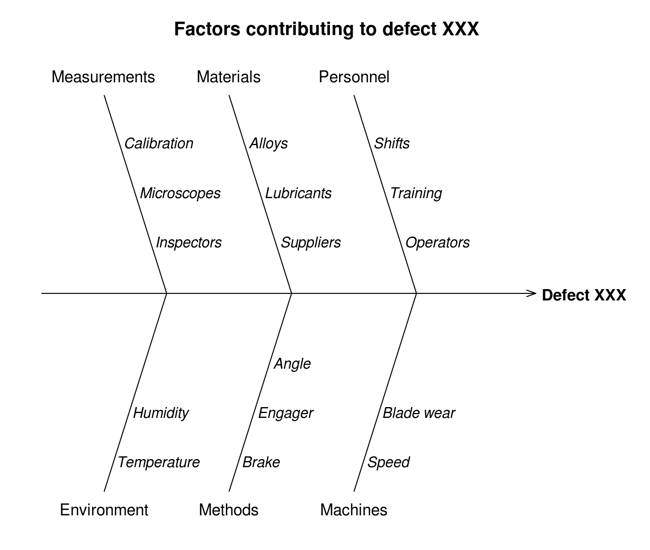
Fishbone diagrams, also known as Ishikawa diagrams, are visual cause and effect charts that help build out the causes from all contributing factors. The problem is considered the "head" of the fish. The causes are categorized as smaller bones under a list of cause categories. The visual aspect helps teams assess options that may not have occurred in abstract thinking alone.
For products with high complexity whose continued performance is critical, failure mode and effects analysis (FMEA) is an option for determining the root cause. This method looks at areas where design failure may occur. In many ways, it is looking for the root cause of defects and failures before they happen. It can help in determining process failures for assembly or manufacturing.
For root cause analysis in critical safety systems where engineering defects can cause disastrous effects, fault tree analysis (FTA) is an effective root cause analysis tool. It helps understand how system failures may happen and what failures are possible. This "undesired state" is then assigned to lower-level fail events in a tree which helps identify possible failures and allows engineers to design to compensate or eliminate the failure risk.
A Pareto chart is another tried and true visualization method that helps teams understand the frequency of problems in root cause analysis. It "ranks" issues visually to help teams know what they need to tackle first. Pareto charts are also valuable when there are many different causes.
By listing them in order of importance, solutions can be crafted first to eliminate the most significant defects. The root cause analysis, often part of lean or six sigma methodologies, can then be repeated to address the following few levels on the chart to continue improvements past the initial phase.
Pareto charts make it easy to pinpoint the 20% of the issues that are causing 80% of the problem.
It has been said that half of life is knowing what not to do. Like the five whys, Is/Is Not Analysis is simple yet powerful. By visually splitting the problem into an "is" and "is not" category, root cause analysis teams can create a list to focus on that helps them understand what conditions affect the situation and which do not. It keeps teams on track and prevents them from listing or pursuing false causes.
Finding the root cause of any problem requires a dedicated team and hard work. And the more manual the effort, the more time it will take for process modification. But process optimization teams today have an ally in the fight to determine root causes.
Data collection is fast becoming the standard in today's manufacturing environments. Sophisticated data collection devices, software, and analytical programs replace the spreadsheets, manually created charts, and human-based input systems used for root cause analysis.
With platforms such as MachineMetrics, companies can now utilize real-time, automated data collection as well as advanced analytics to render usable, standardized, and contextualized data for those searching for root causes to problems. This data collected directly from the control of machines means that the accuracy and unbiased root causes can be determined faster and more effectively than manual processes.
Let’s explore some examples of how MachineMetrics can be used to identify the cause of issues on your shop floor:
The current shift dashboard is a great solution for monitoring production progress in real-time. It provides visibility of performance to goal so operators can compare expected and actual performance. In this way, you can empower operators and managers to identify problems on the fly.
This is a great short term and real-time strategy for addressing issues on a day to day manner, before a more in-depth analysis is able to be completed.
There are multiple views that can be used for the current shift dashboard, including parts goal, OEE, utilization, and downtime.
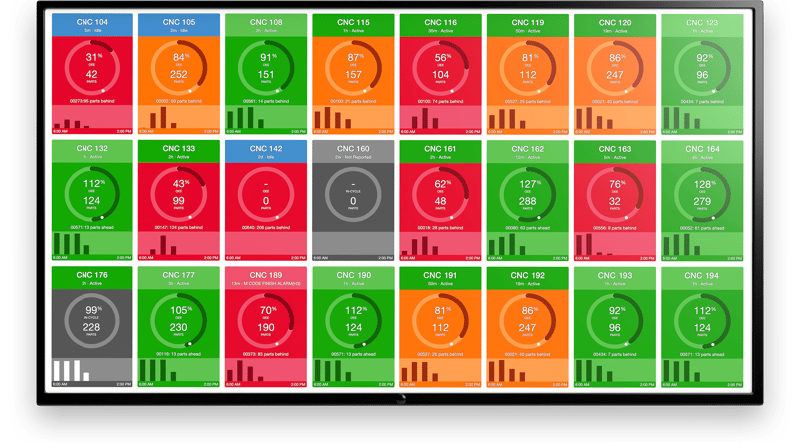 Our customers typically mount monitors throughout the shop floor so that all stakeholders have complete visibility across all applicable machines.
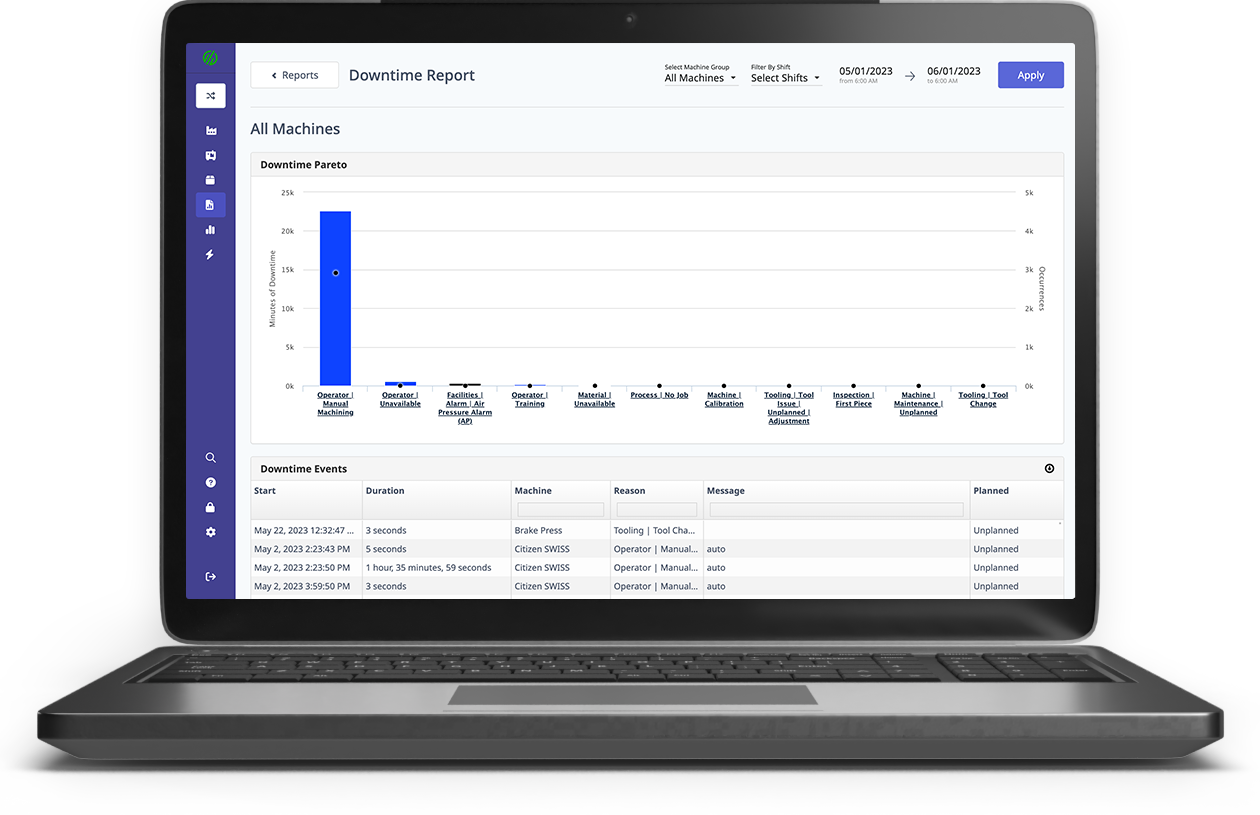
One of the most useful reports for understanding downtime reasons is the Downtime Pareto, which will aggregate all the logged downtime reasons.
With this report, you can easily identify the most egregious downtime reasons. Furthermore, you can segment the data amongst different shifts, machine cells, or even individual machines for a more drilled-down look at where problems may lie. Further, you can see where unplanned downtime is occurring versus planned downtime.
Common categories of downtime include excessive tool changeover, excessive job changeover, lack of operator, and unplanned machine maintenance. With MachineMetrics, not only will you have an accurate view of downtime, but you will be able to determine where your problem is.
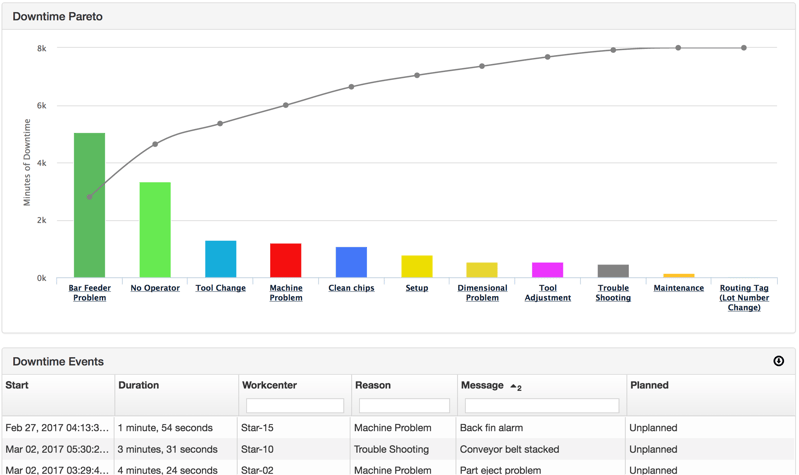 The MachineMetrics Downtime Pareto visualizes the top reasons for downtime on the shop floor.
There are a lot of metrics available in the MachineMetrics Production Report. Continuous improvement managers, shop floor supervisors, and engineers can analyze the production report to better understand how a plant is performing. When it comes to optimizing your efficiency, there are several production efficiencies and job run time metrics you will want to ensure are in the report:
Production Efficiency
The metrics available in the Production Report related to machine production efficiency for a completed Job include:
Job Run Times
The metrics available in the Production Report related to machine run times for a completed Job include:
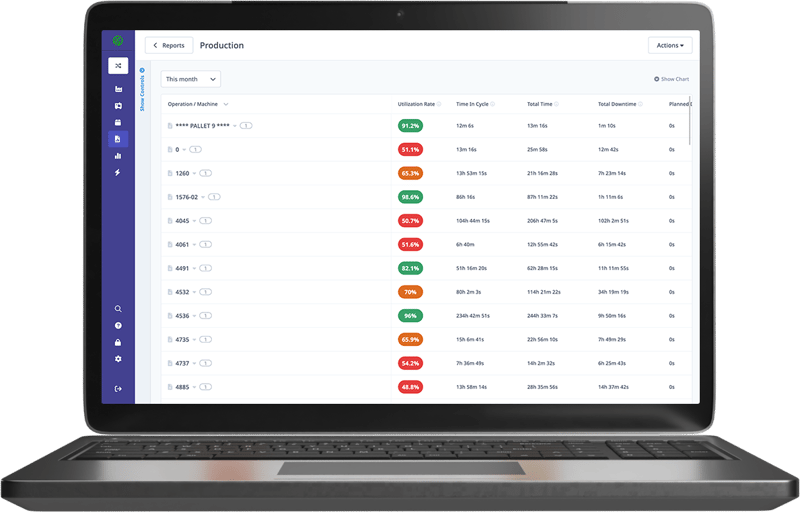
The Production Report is filled with information on how efficiently parts and jobs are being completed.
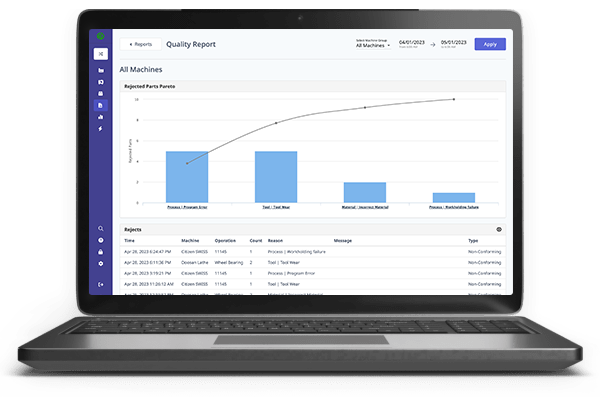
Just as root cause analysis is used for process improvement and eliminating waste and non-value-added work in manufacturing, it’s also used for identifying quality problems at their source. Reducing or eliminating out-of-specification parts that need to be reworked or scrapped is an achievable goal with a machine data platform like MachineMetrics.
Quality root cause analysis is possible using the same tools in the MachineMetrics platform for process improvement and factory monitoring. Sensors and connected devices that detect products out of specification allow operators and technicians to intervene quickly, significantly reducing material and labor lost to scrap.
The tablets and HMIs at operator stations and accessible by laptop, phone or PC allow users to review scrap and rework using Pareto charts and understand which quality issues result in the most rejects. Other KPIs useful for quality root cause analysis include first pass yield, variance reports, and others.
While real-time data collection and analysis are invaluable tools for root cause analysis, quality root cause analysis with MachineMetrics is extensible beyond process improvement. Machine data linked to the platform and driven by advanced maintenance management software allow for predictive maintenance strategies that help predict quality problems.
This forward-looking, predictive capability is further enhanced by the ability to capture high-frequency data to predict failure ahead of time. This capability allows for quality root cause analysis at the deepest level. It helps companies select better tool management, develop more aggressive maintenance strategies, and faster, more informed responses to quality problems before they occur.
With MachineMetrics, shop floor data is automatically collected in real-time, and standardized to propagate out-of-the-box (and custom) reports and visualizations. Put power back into the hands of decision-makers with accurate data that explains exactly what is happening on the shop floor, provisioning the visibility to make better decisions.
Start identifying inefficiencies and fixing problems today. Book a demo with our team today to discuss how MachineMetrics can reduce downtime, increase capacity, and drive bottom-line impact for your organization.
Ready to empower your shop floor?
Learn More

.png?width=1960&height=1300&name=01_comp_Downtime-%26-Quality_laptop%20(1).png)


.gif)


Comments