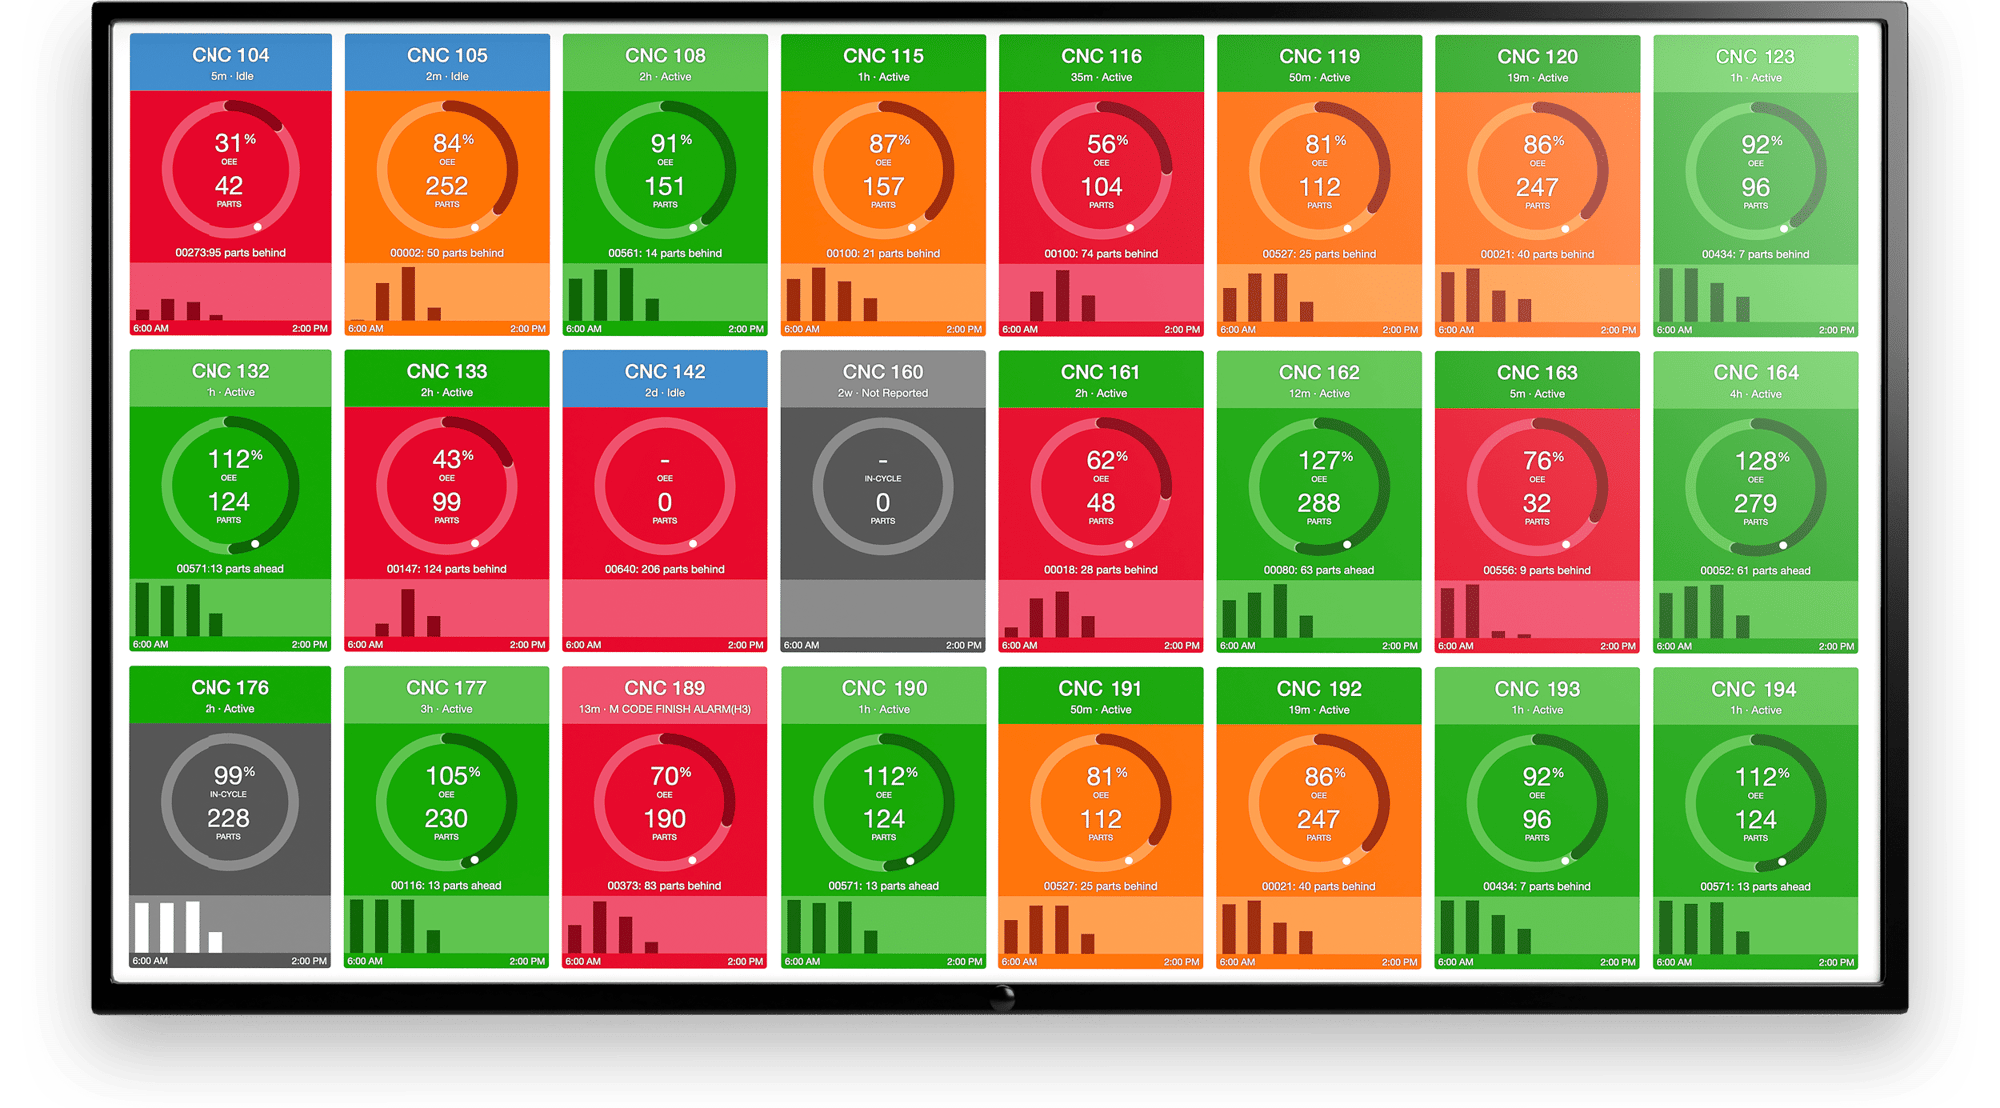
Overall Equipment Effectiveness (OEE) is often seen as a manufacturing KPI metric. Yet it can be a financial key performance indicator for executives as well.
Better still, instead of a lagging indicator showing what happened, you can turn it into a leading indicator of what will happen. You can then use it to drive the overall financial performance of your enterprise.
What is OEE?
Conventionally, it is a measure of how much a manufacturing facility is being used, compared to the full level it was designed for. OEE can be calculated as Availability x Performance x Quality. We can simplify as follows. Availability is uptime. This is total time, minus maintenance downtime and unscheduled downtime. Performance is the speed at which products are produced, compared to the maximum potential speed of production. Quality measures the numbers of products passing quality tests compared to total products made.

So, suppose you had no downtime ever (100% availability), products being made at top speed as per the facility design (100% performance), and no rejects (100% quality). You would then have: 100% x 100% x 100% = 100% OEE.
Linking OEE to Profit
But how does this link to bottom line dollars? There are two ways to connect OEE with financial metrics and catch the eye of CEOs and CFOs.
The first way is to link OEE to overall enterprise profit. This then links to metrics like profitability (profit divided by revenues) and return on capital employed or ROCE (profitability divided by capital turnover rate). How do we link OEE to profit? We first multiply OEE and the theoretical production rate to get the actual production rate (yearly, for example) of products. This actual rate multiplied by the margin per product gives us total margin (yearly, in this example). Total margin minus fixed costs gives us profit.
The second way is to link each of the three parameters of availability, performance, and quality (or in fact, the related costs of downtime, slowness, and reject rate) to dollar equivalents. Financial indicators at this level are also effective because everyone understands the need to cut costs. And the more the enterprise gains by improving performance on a given parameter, the higher the incentives can be for employees to make it happen.
Quick Cost Arithmetic
Basic math is enough for calculating these costs:
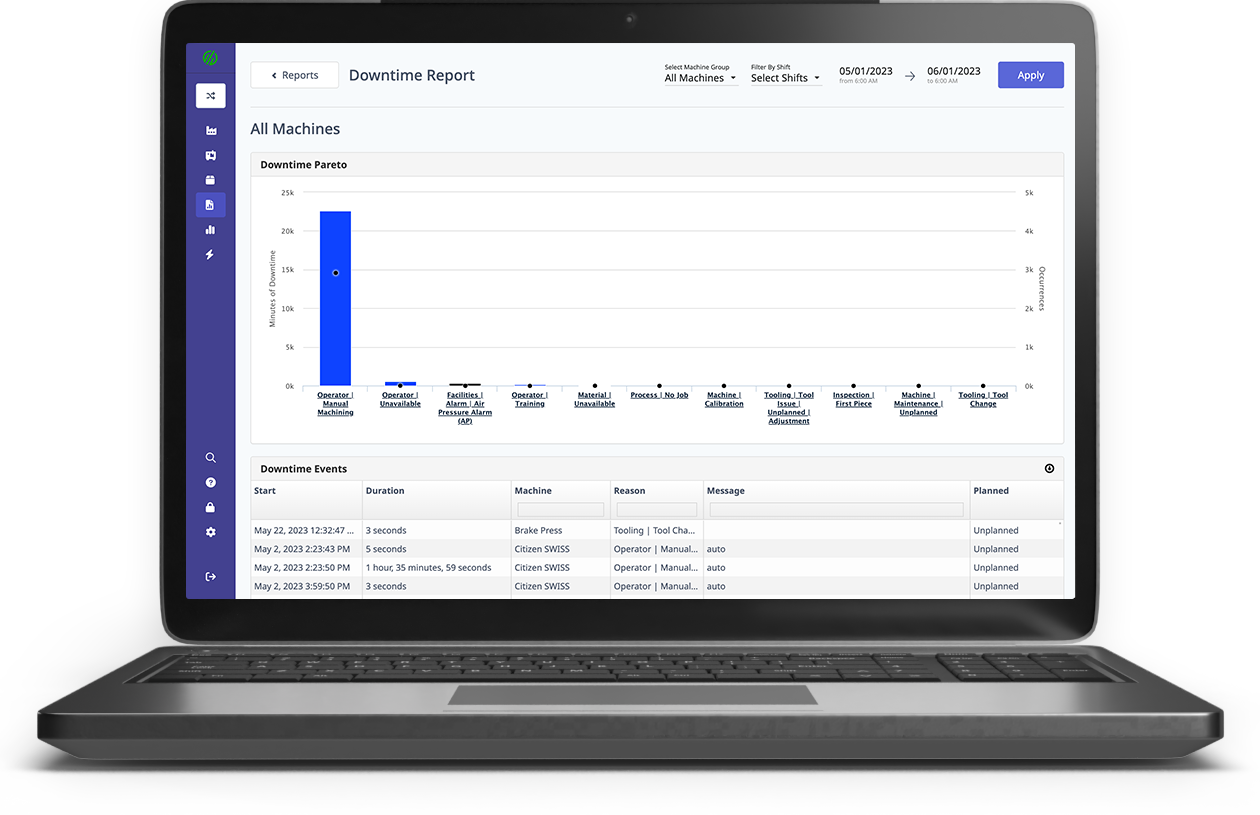
- Downtime cost is hours of downtime multiplied by hourly cost of downtime (employee time, fixed machine costs, for example).
- Production slowness cost is given by the extra time needed to run a machine or line to make up a production deficit, multiplied by the hourly cost of operating that machine or line.
- Reject cost is the number of rejected products multiplied by the cost of each product (does not consider the impact of rework).
Now, plug in the figures that apply for your facility. It should be easy to see the relative impact of each of the parameters above and priorities for improvement. For example, suppose you have high machine or line operation costs and a large gap between design-optimal manufacturing speed and actual speed. In this case, manufacturing performance improvement could be your priority for increasing OEE.
OEE for Driving Your Business
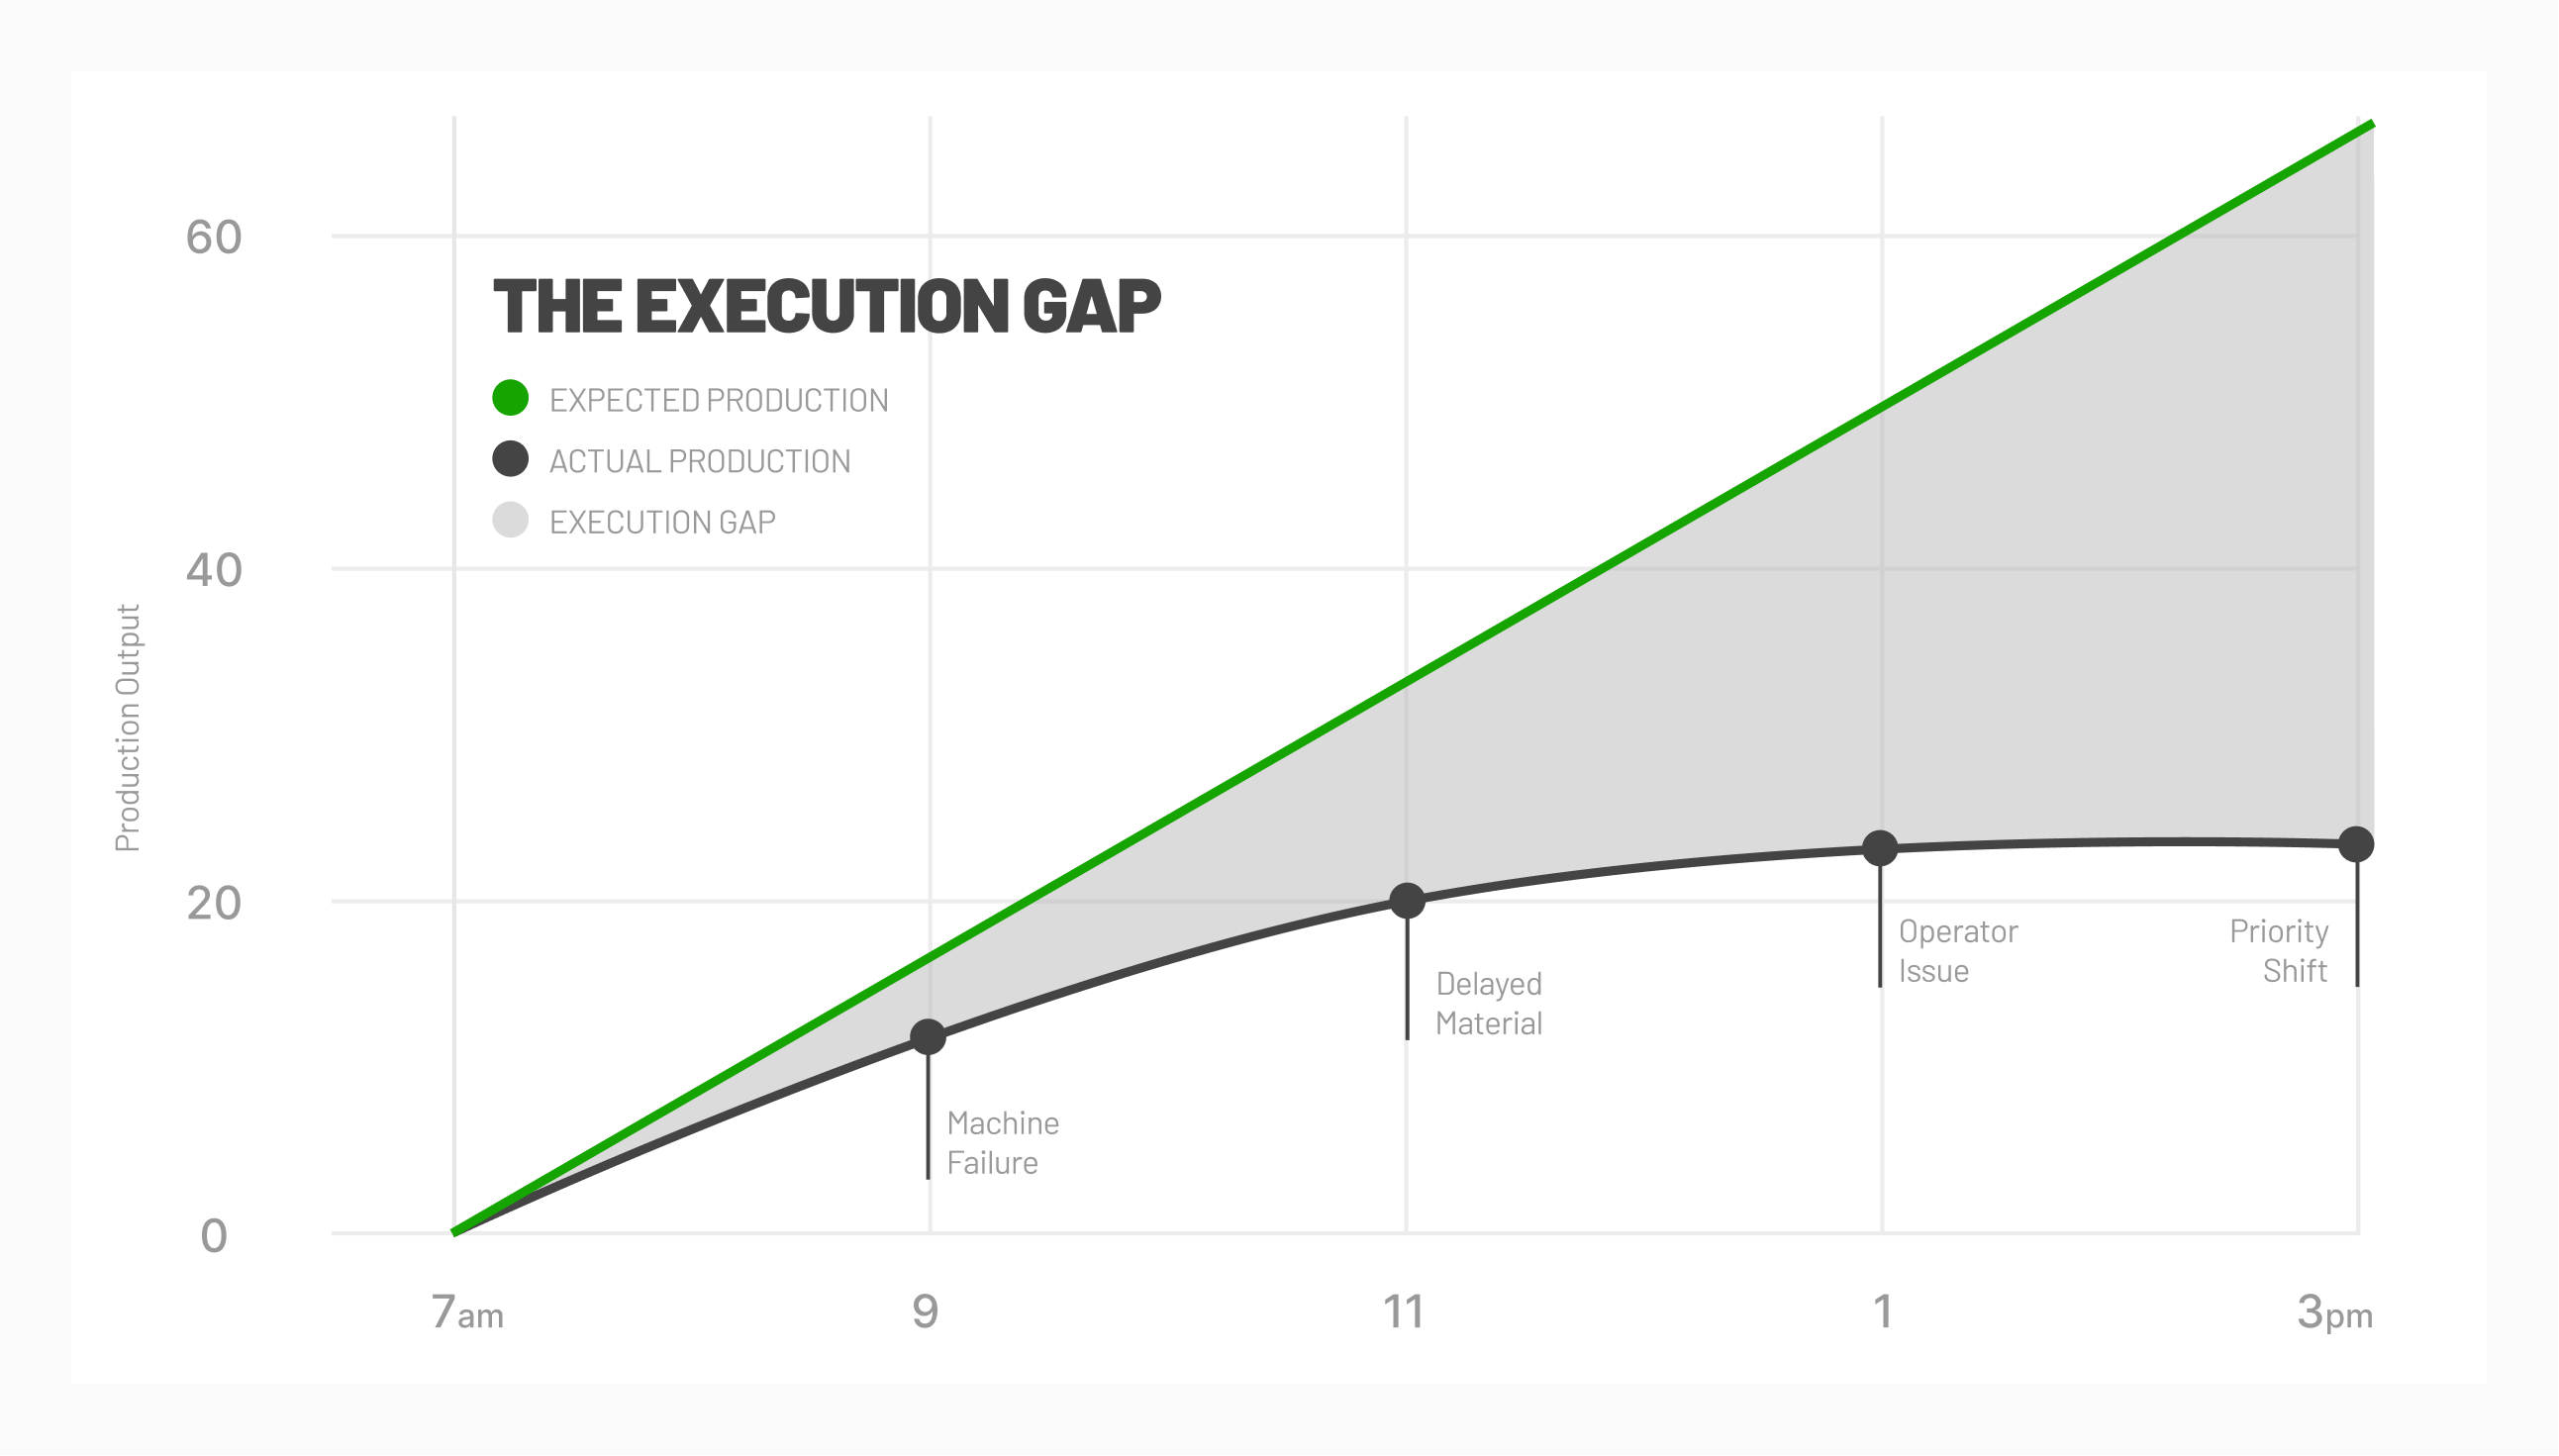
Finally, you can also change OEE from a lagging or after the fact indicator, to a leading indicator that you can target for improvement. You will know in advance how other financial indicators like profit, profitability, and ROCE will increase as a result. Want 10% more profit from your company? Use your OEE lever to get funds for any necessary plant upgrades, generate the extra profit, and attract positive top-level management interest.
.png?width=1960&height=1300&name=01_comp_Downtime-%26-Quality_laptop%20(1).png)

.gif)





Comments