
Book a Demo of MachineMetrics
The leading platform to collect, monitor, analyze, and drive action with machine data. Set up time with a product specialist to learn how we can help your operation.
Ready to empower your shop floor?
Learn More.svg)

Today, we released two new features which offer our customers powerful ways to capture the reasons why their machines are down as well as provide real-time visibility into the utilization of the entire facility.
Real-time Downtime Categorization
Until now, managers could categorize downtime via our timeline view. This is great for longer downtimes, but can be a bit cumbersome when trying to capture all of the reasons why machines aren’t operating at their peak performance. Now in our Workcenter Views, machine operators can categorize downtime in real-time. This provides the best opportunity to capture the most accurate information as possible and helps managers get even more value out of our Pareto reporting.
 Operators are prompted when machine is down
Operators are prompted when machine is down

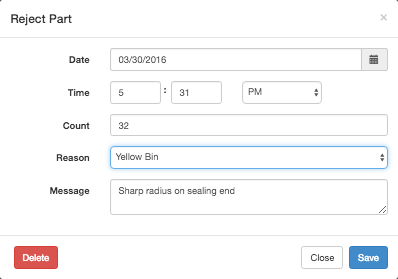
Operator selects a reason

Operators can enter an optional message as well
Operators can enter an optional message as wellWhen the workcenter goes back into production, we make sure that the reason is applied to the entire downtime period. All of this is visible through our downtime Pareto reporting.

Utilization and Downtime Dashboards
Setting goals is key to being able to improve your manufacturing process. Prior to this release, goals were always based on part production. The color of the tiles on the dashboard would change to differentiate between ones that were meeting their goals, slightly behind, or far behind. Now, you can view your workcenters in MachineMetrics in two completely new ways by setting utilization goals or just see which workcenters are currently running.

Tile colors are tied to percentage goals that are configured for each workcenter.

Tile colors are tied to the amount of time the workcenter has been inactive.
Tile colors are tied to the amount of time the workcenter has been inactive.These dashboards are a great way to get started with MachineMetrics. No need to input your schedules, just set utilization goals for each workcenter (or don’t, we set some good defaults) and you’re on your way.
We’re really excited about these new features and hope they’ll help you get up and running faster. Please contact us if you have any questions or feedback.
Ready to empower your shop floor?
Learn More

.png?width=1960&height=1300&name=01_comp_Downtime-%26-Quality_laptop%20(1).png)


.gif)


Comments