Key Takeaways:
- Visual lean tools help manufacturers identify inefficiencies and streamline processes.
- Tools like kanban boards and visual workspaces promote transparency and productivity.
- Implementing visual lean tools supports continuous improvement in manufacturing operations.
Visual Lean Tools are incredibly powerful problem solving tools when used correctly. They are a vehicle that can help drive your company’s success and help you avoid potholes. If you want it to work the most important thing is to pick the software package that best suits your situation. You don’t need a Ferrari for a daily driver and you wouldn’t take a go-cart for a cross-country voyage. Finding the correct match is step one on the path to success.
Getting Started
If you already have a manual process in place with machine settings and production goals then the transition to visual lean software becomes about choosing settings and options. If you’re tracking data for the first time, don’t panic. You don’t have to have all of the answers up front. You can use the software to get a baseline and then set realistic goals based on reliable data.
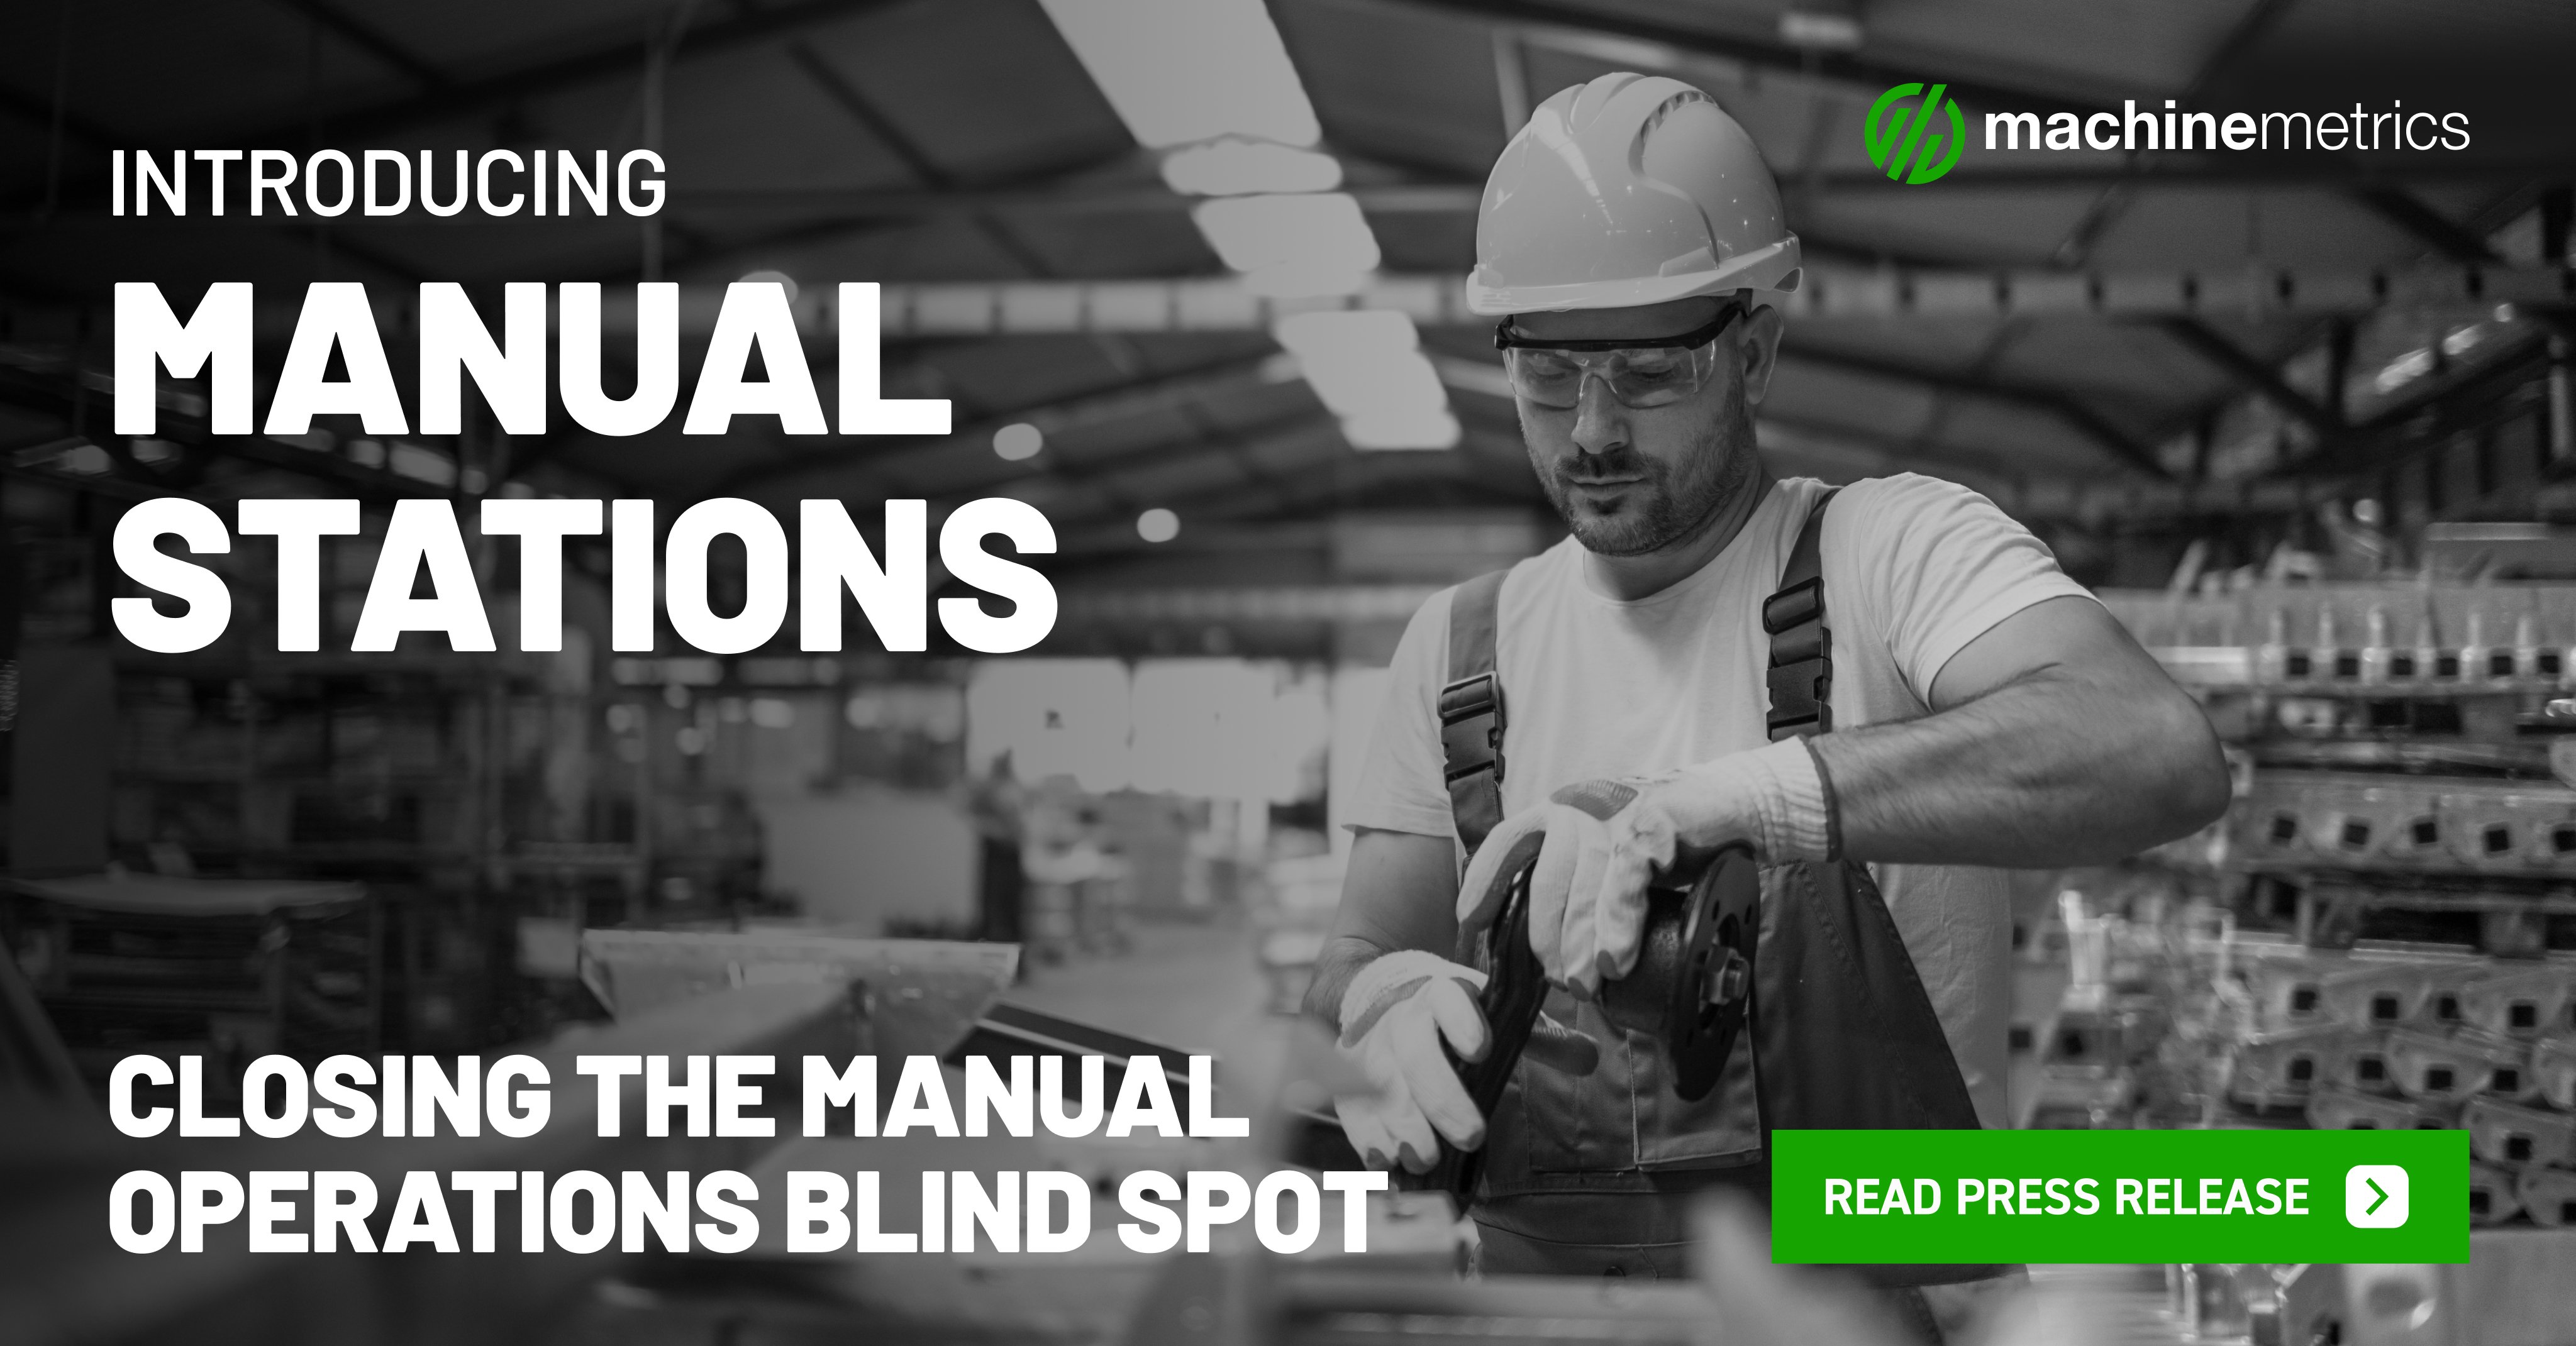
In addition to automated processes, MachineMetrics production tracking software allows you to track manual processes such as grinding or welding without using complicated tracking spreadsheets and logbooks. All you need is a touchscreen device next to the work station. It’s as simple as using an app on your phone.
Company Culture and Commitment
Implementing a visual lean system must be a team effort. You should have people from the production floor involved in the process, not just the managers, so that you have employee input. This will help them see that visual lean tools are about identifying opportunities for improvement and the resources needed to make them happen, not blaming machine operators. This is key to long term success.
Choose Color over Clutter
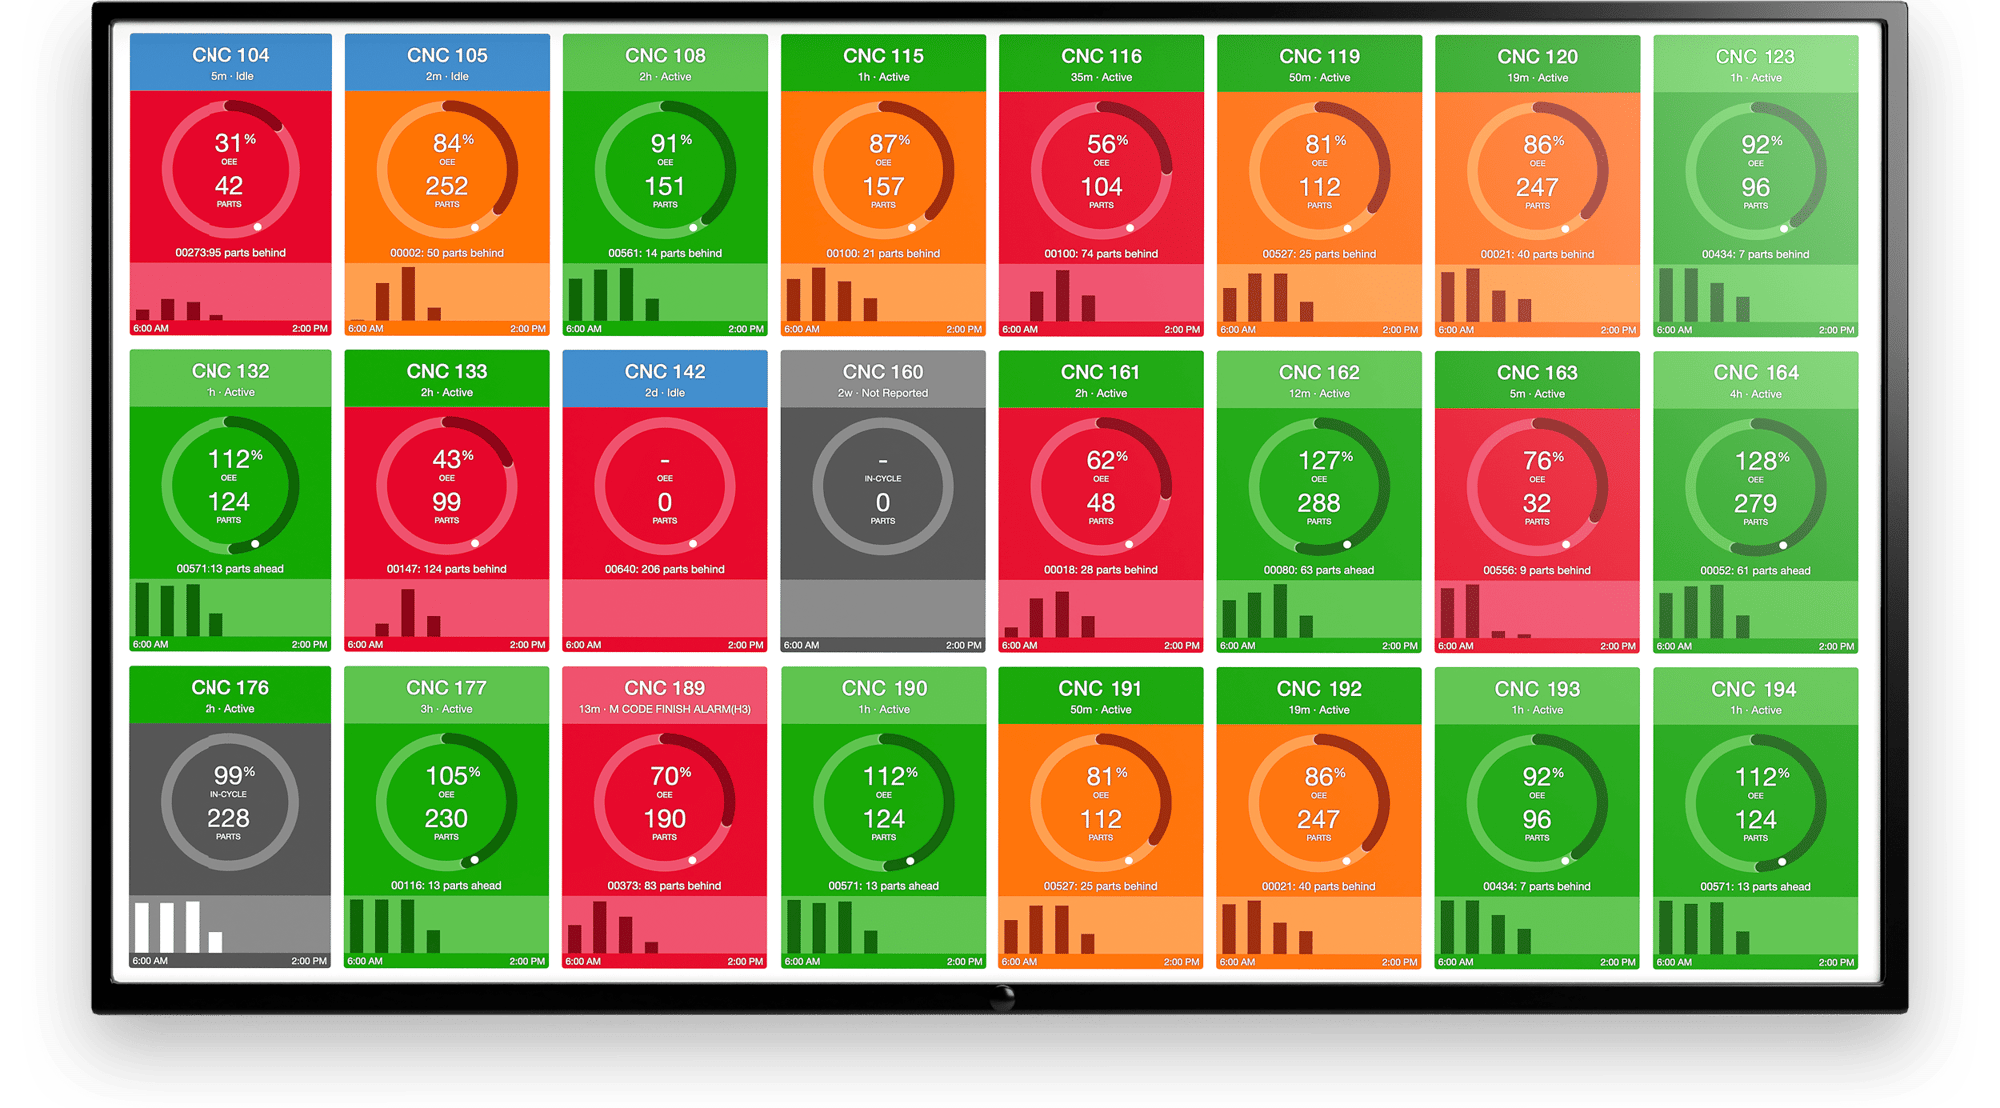
Collecting data is critical but displaying every piece of data is overwhelming and counter-productive. By using a simple color scheme and displaying the data that shows the operators the overall status of the machine you can convey a tremendous amount of information.
It is also important to have different screens for different employee levels. The operator on the production floor doesn’t need the same level of detail as an engineer or manager. Customization is key. The average person is far more comfortable with the dashboard of a car than the overwhelming sea of dials, gauges and switches in an airplane cockpit, but when you’re ready to fly you need to have more information at your fingertips than you need for a drive in the country.
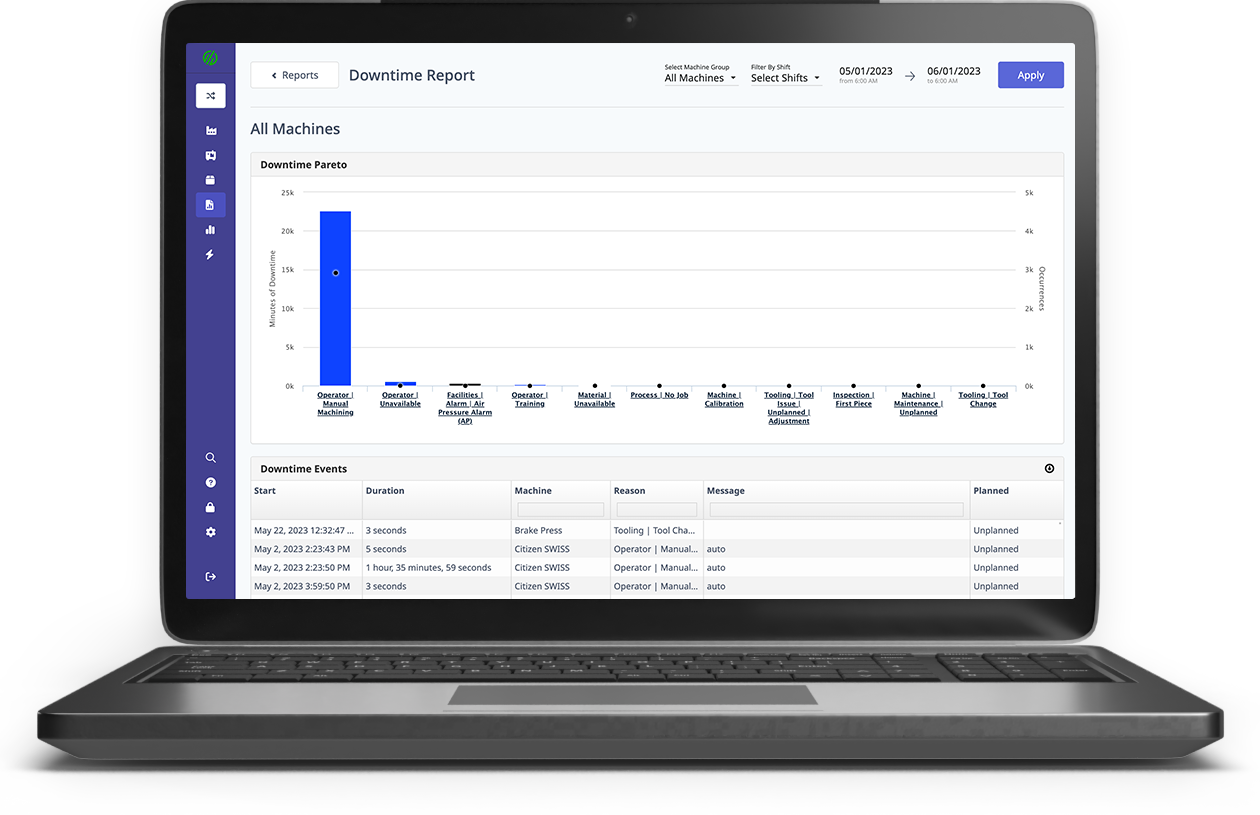
MachineMetrics offers different views such as the Work Center and Downtime screen and the Shop Floor Dashboard. This allows employees to stay on top of everything with a quick glance as opposed to studying a spreadsheet.
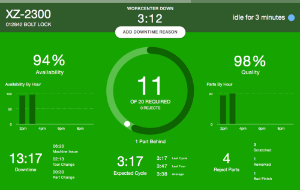
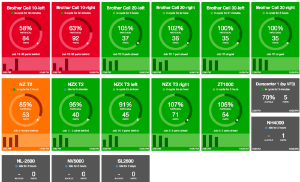
You can collect lots of data in the background but only display what the operator needs to know. The interface should be simple like the dashboard of your car while still letting you know how to react to the information you are being given. If your check engine light comes on you react with a different sense of urgency than if your windshield washer fluid light comes on. MachineMetrics software provides this type of information.
Visual lean tools are an excellent way to put information at your fingertips. It is important to remember that, while they won’t solve your machine downtime overnight, they provide the critical information needed to make timely and successful business decisions. MachineMetrics software helps you go from red to green and gives you the power of easy to digest data needed to capture the checkered flag. It’s time to start your engines!
.png?width=1960&height=1300&name=01_comp_Downtime-%26-Quality_laptop%20(1).png)


.gif)


Comments