
Book a Demo of MachineMetrics
The leading platform to collect, monitor, analyze, and drive action with machine data. Set up time with a product specialist to learn how we can help your operation.
Ready to empower your shop floor?
Learn More.svg)

Manufacturers face a mountain of challenges to produce the goods we use in our lives. And each one must address these challenges with limited resources in the form of capital, skillsets, technological advances, and more. The managers who orchestrate this complex arena best look for ways to maximize the tools they have at their disposal by understanding their shop's capacity. Better use of manufacturing space, materials, labor, and optimized equipment performance is critical for companies to drive increased production capacity and more efficient production and capture the highest profitability.
A capacity analysis can be an excellent solution for auditing a manufacturing plant and diagnosing if there is hidden capacity waiting to be unlocked.
The goal of every manufacturer is to run its operations at full capacity. But what is manufacturing capacity? The short answer is that manufacturing capacity represents the state in which all equipment and resources within a company are utilized at the highest operation rate for the product mix and volume their industry requires. This means that all processes from operations to maintenance are optimized with a set amount of resources and that no unnecessary downtime is incurred. When this condition is reached, the equipment has reached full capacity.
Many factors further complicate the journey to this ideal state. A factory may suffer from a rash of availability losses such as mechanical failures where valuable time is lost for repair. Or they could lose valuable production capacity due to changeovers, setups, and adjustments.
Manufacturing capacity can also suffer from performance losses. These include untrained or inexperienced operator actions and stops for jams, idling, runouts. These are often addressed hurriedly with little analysis of what caused it and how to prevent it from happening again.
Finally, manufacturing capacity can be negatively impacted by quality losses, including both process defects and yield reductions. Some causes include an under-optimized workflow, human errors, or a broken process. In addition to robbing a factory of valuable capacity, quality losses can also generate added waste that may need to be reworked or thrown away, adding cost to the product.
These hindrances to capacity are often referred to as the Six Big Losses. And their effects can be devastating. At best, a lack of understanding of capacity can trigger expensive overtime, waste, missed deliveries, or unnecessary capital expenses in the form of new equipment to make up for the loss.
When a manufacturer needs to increase capacity, they often start with the kneejerk responses above. However, one can only purchase so many machines and schedule so many shifts before the focus on improving capacity moves inward. And the best way to pinpoint where action should be taken to increase capacity is using data in a manufacturing capacity analysis.
The process of manufacturing capacity analysis is the difference between potential capacity and the actual output a company currently achieves. By collecting production data, manufacturers can identify what process, equipment, or function needs to be changed to increase capacity. This capacity analysis will essentially allow manufacturers to drive greater utilization from their existing resources via process optimization.
Further reading: How to Increase Manufacturing Production Capacity
Manufacturers that perform an analysis of their capacity are able to reduce downtime and waste. They can also mine the data uncovered in their analysis to optimize processes and streamline workflows. Doing so can help them understand what the existing constraints are and make real-time decisions to solve problems as they happen. As data in the analysis supports these solutions, managers can drive improvement throughout the operation and increase capacity without additional investment in equipment or labor. For companies looking to improve their manufacturing capacity, here are the steps required on how to calculate a capacity formula to unlock hidden capacity:
The quest to learn how to calculate capacity begins with data. If you don’t know where you’re at, you’re not going to see where you’re headed. It’s common to overestimate current equipment utilization as many companies may not even realize that utilization is as low as it is. So, your capacity formula needs to be accurate.
Benchmarking includes determining existing capacity. Machine speed, quality losses, downtime by categories – such as breakdowns, changeovers, and performance losses – must all be measured to determine the current capacity. And in many cases, that number is shocking. Several best practices can be used to create a solid and practical framework for benchmarking:
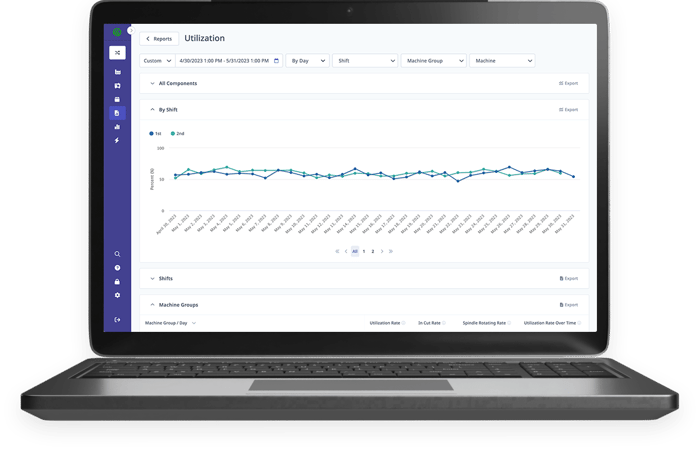
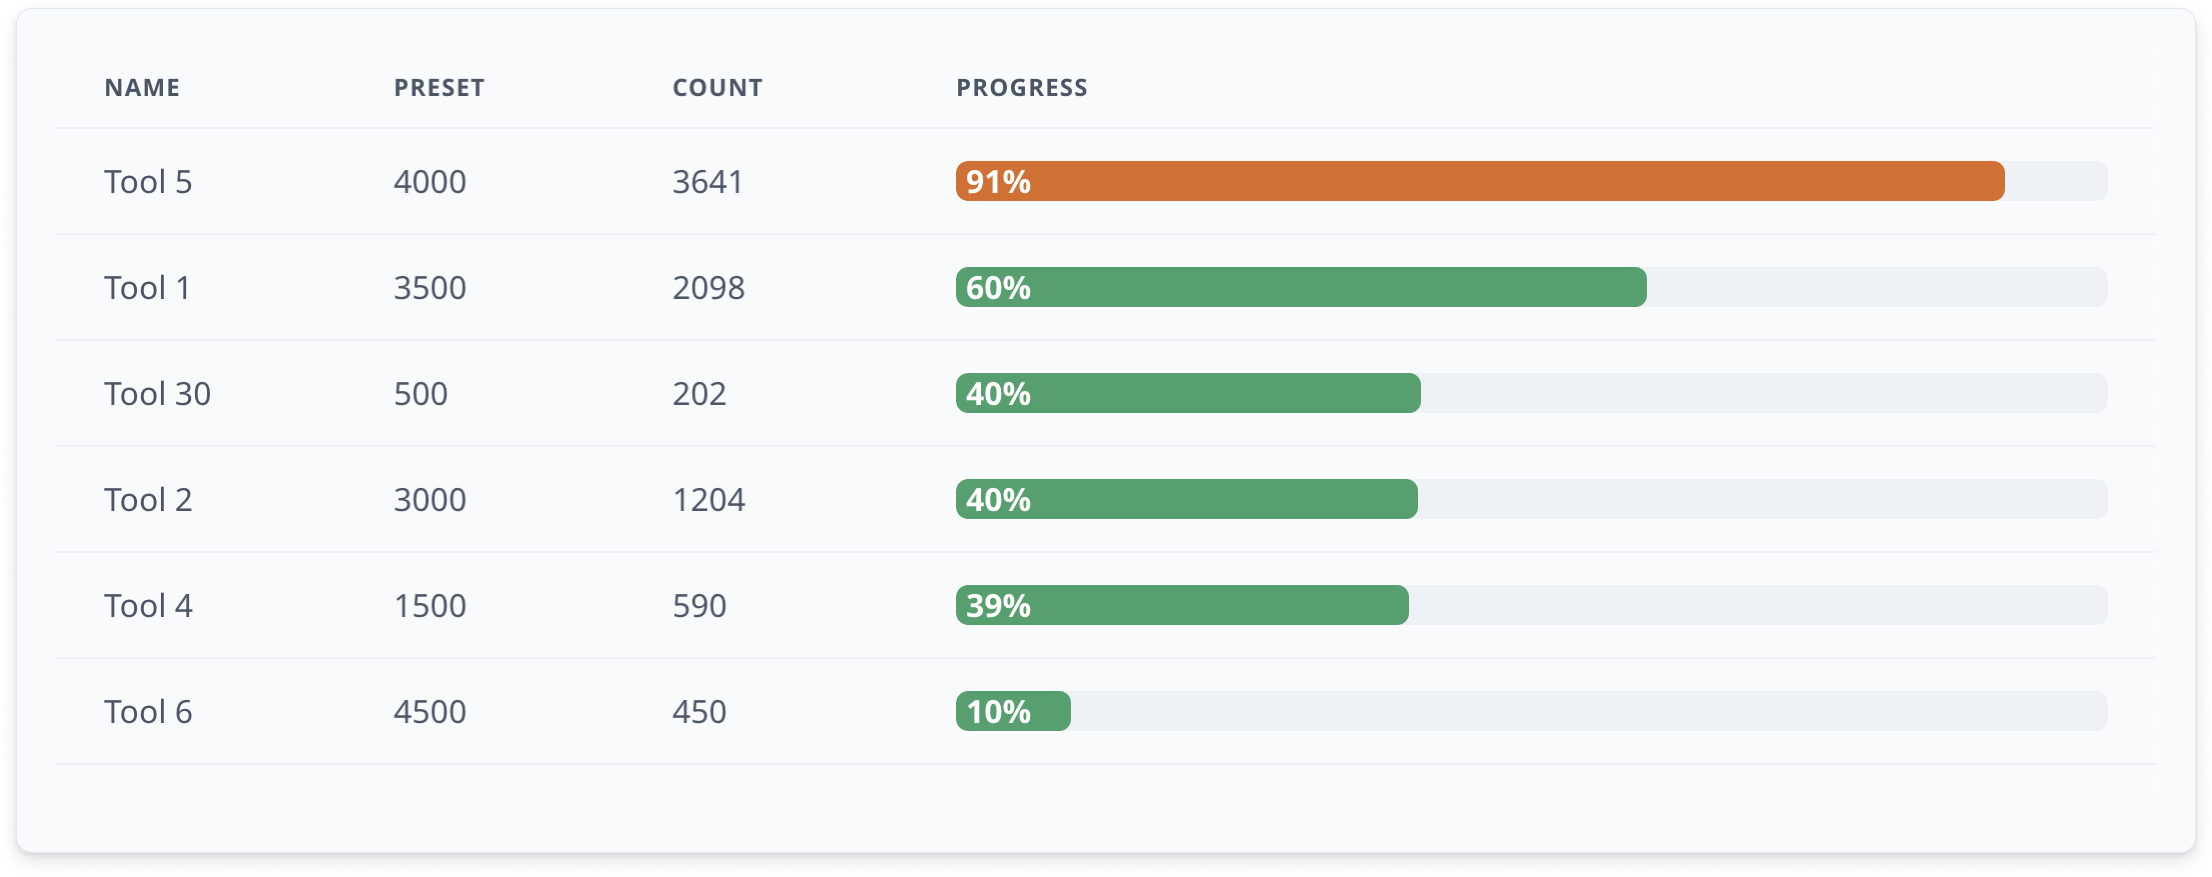
An example of a MachineMetrics utilization report, one of many pre-built reports that can be used for benchmarking data.
Once a manufacturing operation has benchmarked its data and understands its true utilization, a downtime analysis must be conducted. This involves managers, technicians, manufacturing engineers, operators, and others who can help identify all the reasons for downtime and plan how to reduce or eliminate it.
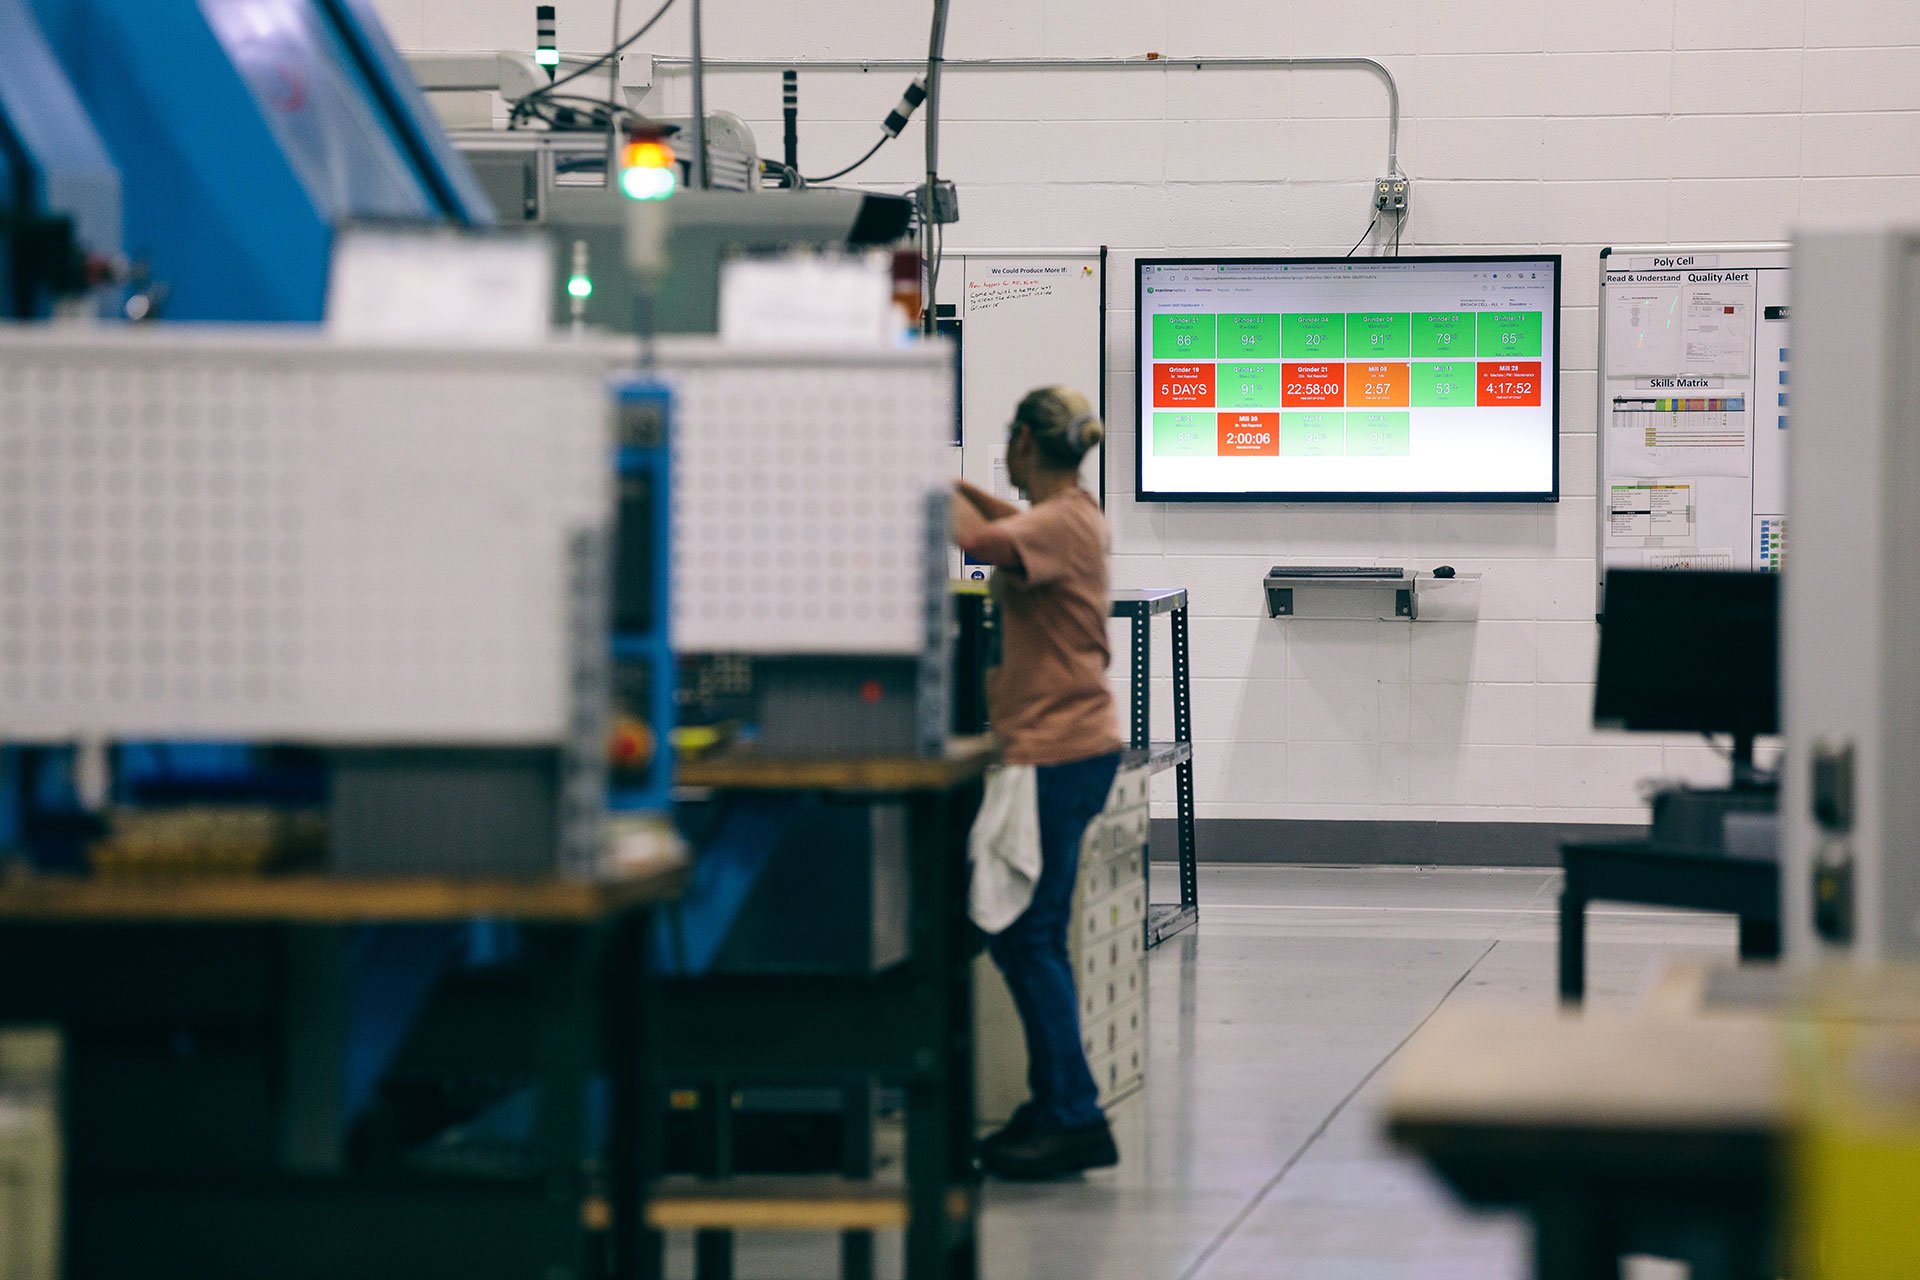
With the revelations that accompanied the benchmarking of the facility, team members can move on to measuring the downtime driving that utilization. By answering how much downtime is occurring and what category the downtime falls under, steps for improvement become more apparent. This is best done by automated machine data collection software to ensure that accurate data is used and standardized and real-time.
It can also be helpful to document the reason for the downtime. Categories to consider may include:
Once the categories are determined, team members can drill down to determine the reasons for downtime within the category. For example, there may be many types of planned downtime, including scheduled maintenance, seasonal production, and others.
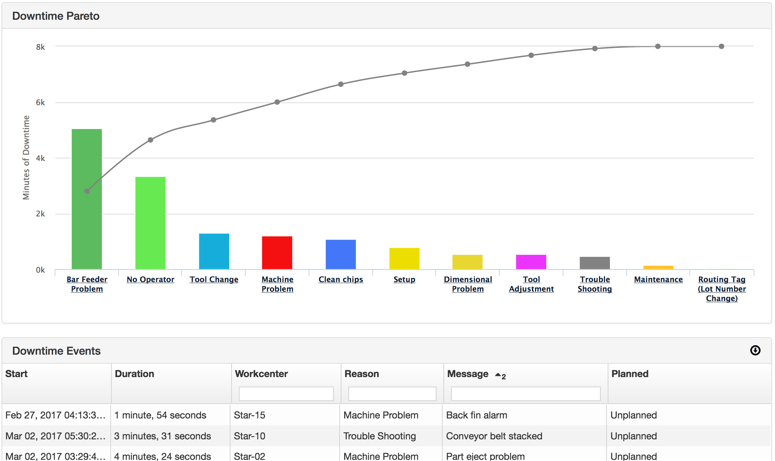
The MachineMetrics Downtime Pareto reveals the most egregious downtime reasons and is a great starting point for finding processes to improve upon.
Likewise, there are countless reasons for unplanned downtime. These can range from material not at the machine when needed to an improperly maintained machine. It may also point to a wrongly designed workflow where material from upstream is not ready when needed, creating a domino effect.
The same is true for human error. Manufacturing operations are becoming more automated, but there is still a need for labor. Fatigue, inadequate training, lack of understanding about the workflow, or broken process steps can mean workers make mistakes they would not otherwise make.
The best way to gather this information is through automation and software. By making the data visualization intuitive and easy to record, operators can utilize a dashboard to enter actual data and see its impact. Just as an operator can enter the reasons for the downtime, tools such as Pareto charts can help understand the downtime analysis as it moves forward. This gives users insights and often helps trigger improvement suggestions.

By the end of the downtime analysis, actual downtime costs and their impact on the bottom line can be determined. This also helps identify the “low hanging fruit,” the quickest and easiest items to fix with the most significant impact on dollars saved and capacity added.
Further reading: How to Track and Analyze Machine Downtime
Managers are now equipped with accurate and verifiable data that drives real change at this point in the analysis. These changes can be used to tackle the most significant capacity constraints, unlock the hidden capacity to eliminate overtime, reduce the need for capital expenditure, and hone a maintenance program that works in sync with changeovers and other operating conditions instead of contention with them.
There are a lot of examples of significant drains on capacity. Here are a few that can be found during most digital transformations:
Expected Cycle Time Longer than Actual Cycle Time
The size and complexity of today’s manufacturing environments can mean that individual performance is buried beneath a mountain of data, volume, and a push for higher production. When data is true, and part counts at the machine are accurate, operators are accountable for their output instead of buried under it. This accountability can be a positive tool that allows them to become part of identifying areas for improvement. As improvements on the most apparent downtime begin to work, further optimization of the cycle time can be initiated to continue the process to include even small changes that add up quickly.
Quality Issues
As mentioned previously, quality is a broad topic that impacts many areas. But that affords more opportunity for improvement. Not only does the 80/20 rule apply for quality, but it also affects the subcategories within it, including human error/training, vendor quality, maintenance improvements, product design, etc. By leveraging unsiloed data analyzed in real-time, the largest culprit in each area can come under improvement steps to render a more considerable cumulative impact on quality overall. As these efforts take root, capacity increases, quality improves, reduces costs, and enhances order and delivery performance.
Further reading: Quality Assurance in Manufacturing: Everything You Need to Know
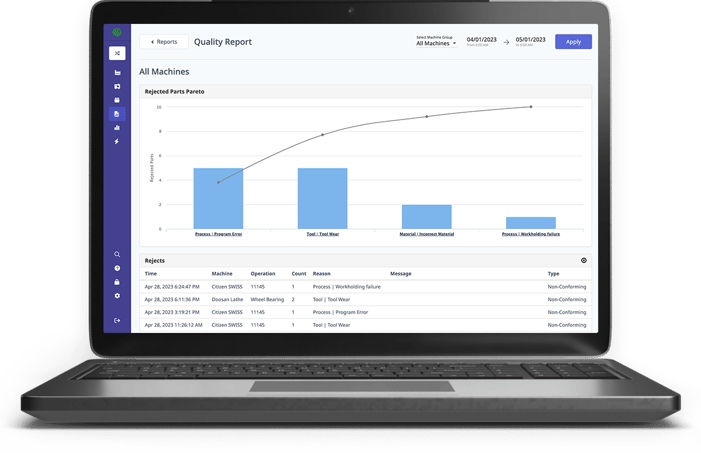 With MachineMetrics, you can easily see the top reasons why parts are rejected and identify the root of the problem.
Equipment Failure
Few things drive manufacturing managers mad as much as equipment failure. And often, these failures are the result of a reactive maintenance program. By running to failure or by inadequate tracking of machine state, companies cede vast chunks of capacity in the form of downtime. But data analytics and real-time machine conditions offer new opportunities to increase capacity. By understanding machine states and deploying IIoT sensors and technology, managers can leave reactive maintenance behind and drive higher capacity and lower costs. One study by Deloitte shows that predictive maintenance programs can increase uptime for equipment by 10-20%.
Workflow
Measuring equipment utilization is more than simply measuring just the machine. By capturing, contextualizing, and analyzing data, managers can view an individual machine and the entire ecosystem of equipment within the facility. This can lead to insights about equipment layout, staging, WIP, and other process-related variables that can be used to increase capacity. While it may point to a need to reorganize a production floor or cell, it may also be as simple as moving a few machines a few feet or changing the way material flows from one station to the next within the workflow that makes the difference.
An analysis of capacity coupled with advanced data capture and analytics can help companies find their path to full capacity quicker than most would think, and lead to a leveled production. When Avalign Technologies struggled to track OEE and downtime, production bottlenecks, inadequate SOPs, and other factors put a drag on capacity.
Using MachineMetrics, Avalign acquired instant visibility across the shop floor to realize a 25-30% increase in OEE and millions in additional capacity, without the addition of labor, equipment, or additional resources.

Ready to empower your shop floor?
Learn More

.png?width=1960&height=1300&name=01_comp_Downtime-%26-Quality_laptop%20(1).png)
Comments