
Book a Demo of MachineMetrics
The leading platform to collect, monitor, analyze, and drive action with machine data. Set up time with a product specialist to learn how we can help your operation.
Ready to empower your shop floor?
Learn More.svg)

Out of all the MachineMetrics dashboards, reports, and visualizations, the Current Shift dash is perhaps the most iconic. A true mainstay among customers, the value of the Current Shift dashboard lies in its simplicity.
It is an easy-to-use, intuitive interface that gives frontline workers the information they need to make faster, more confident decisions. Simple color coding provides an at-a-glance indication if the job is performing at or below expectations, all presented in real-time. It is one of the most basic yet powerful tools in the MachineMetrics platform.
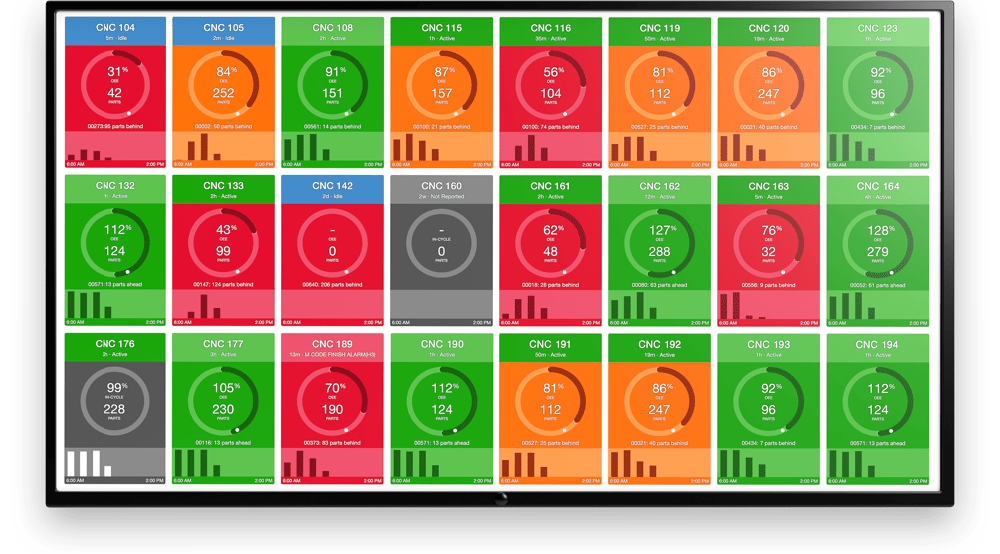
The Current Shift Dashboard provides operators and managers an at-a-glance overview of all of the machines on your shop floor at once. Each tile on the dashboard represents a single machine and it’s performance for the current shift. Color changes on the tiles indicate that the machine is meeting, exceeding, or falling short in performance.
Although this may sound simple (and it is), empowering your shop floor with our dashboard consistently helps our customers quickly achieve a 10-20% increase in utilization. The fact is, just having a visual shop floor drives changes in behavior, making this increase achievable for all MachineMetrics users.
In this article, we will take a deeper look at this pivotal MachineMetrics feature and discuss the value of deploying it at your facility.
There are a number of default views that users can set for their Current Shift Dashboard, which include the following:
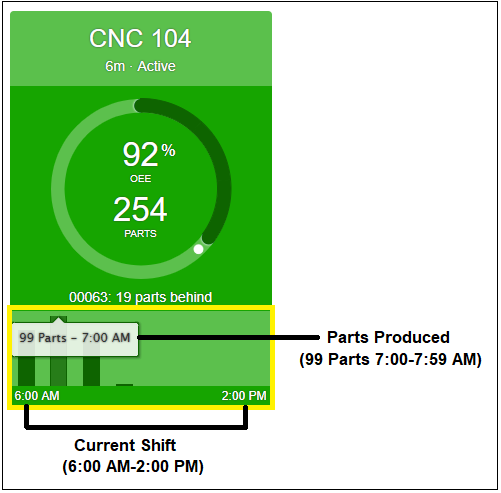
No matter which view is selected, each connected machine is represented by a "tile" graphic. In most dashboard views, these machine tiles provide information on the (1) machine operating status, (2) machine performance, and (3) hourly part production or utilization. The Downtime view offers minor differences, as shown below.
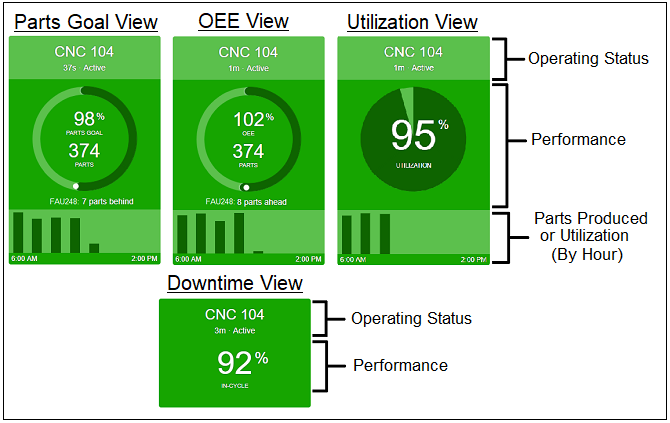
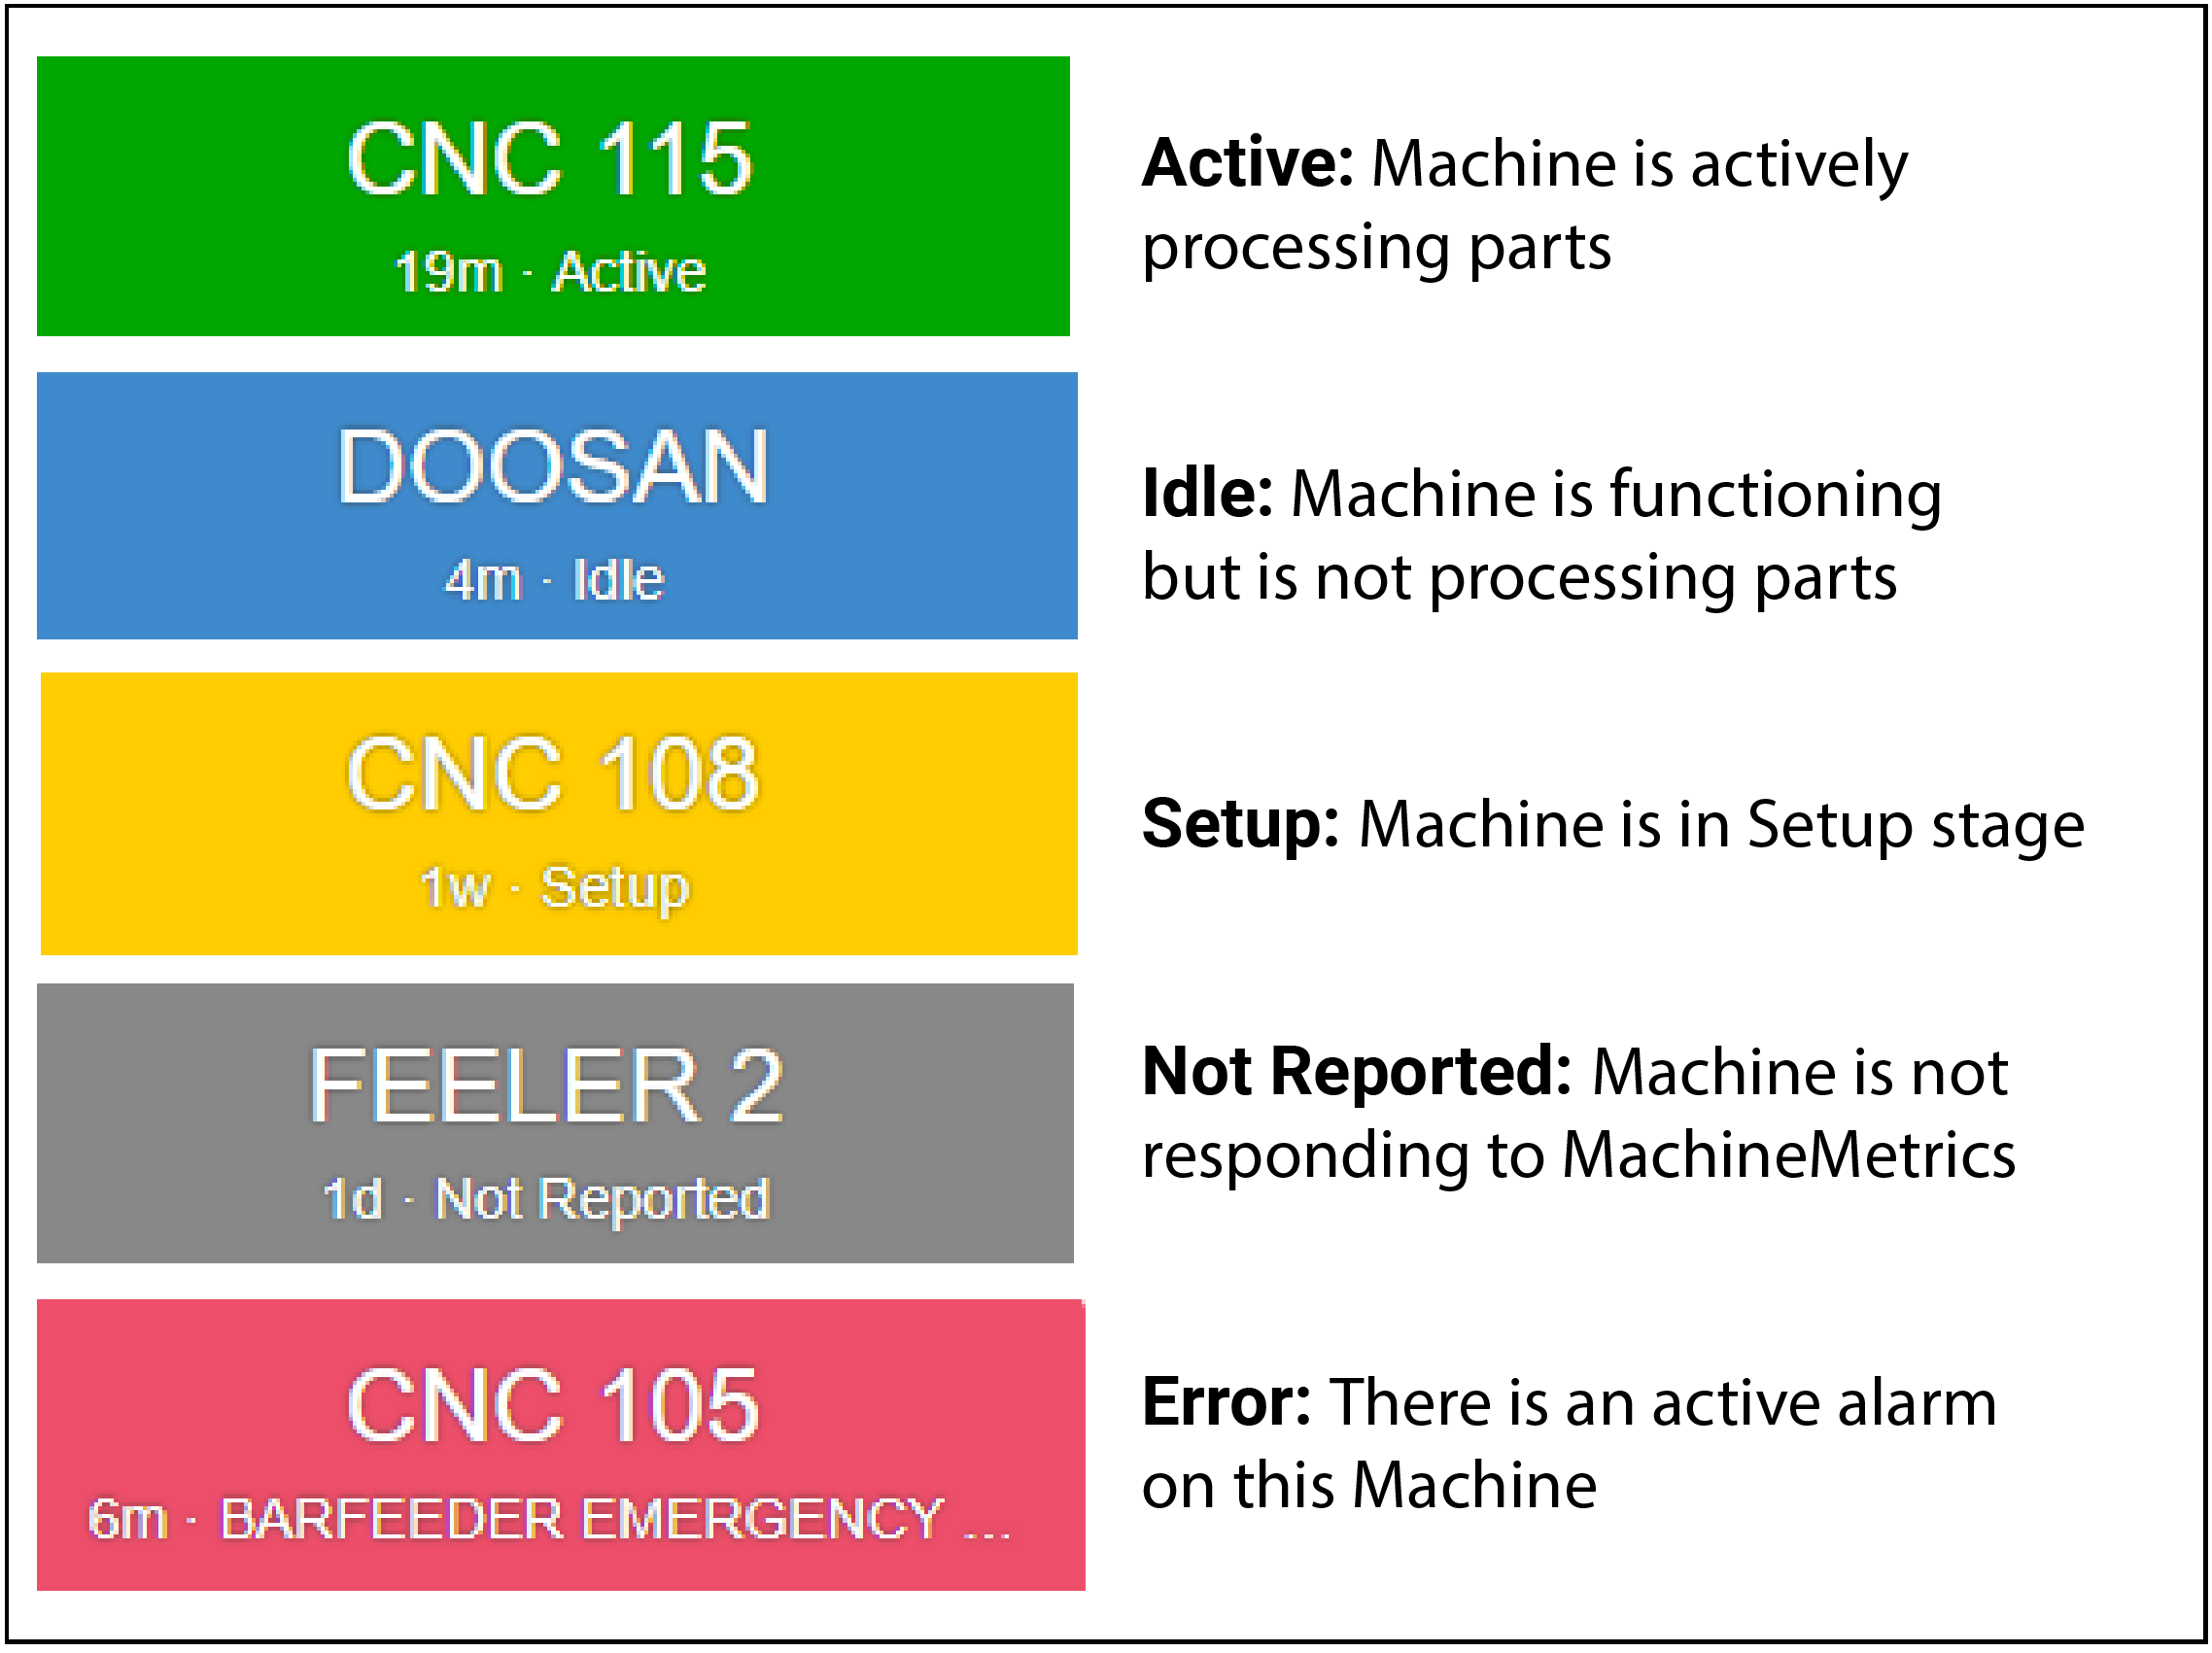
The operating status section of each machine tile displays text indicating the machine name, the current machine operating status, and the amount of time that the machine has been in the current status. The current operating status of the machine is also visually indicated by the color of the tile.
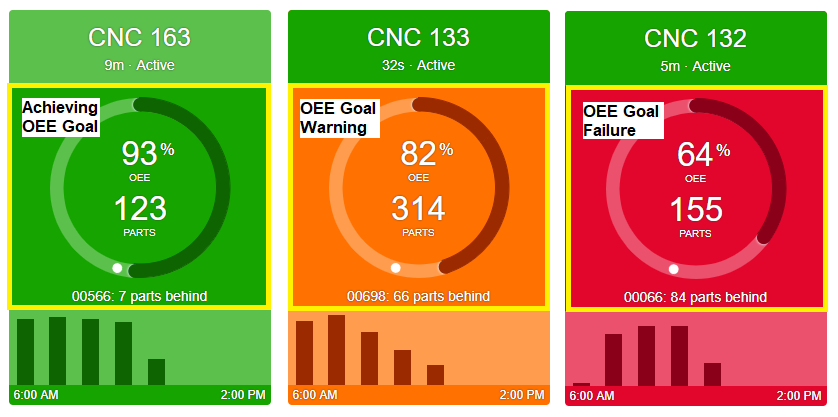
The performance section of the machine tile provides the current performance percentage and visual indicators that indicate how the machine is currently performing compared to the goal that the view presents (Parts Goal, OEE, or Utilization).
Here is an example of how this would look for the OEE view.
The parts produced/utilization by hour section of the machine tile displays a bar graph where a bar will appear for each hour covered by the current shift where machine activity has occurred. No bars will appear if no activity has occurred in the hour that passed. In the Parts Goal and OEE views, hovering over a bar will display the hour represented by the bar and the number of parts produced in that hour. In the Utilization view, hovering over a bar will display the hour and the percentage of utilization for that hour. The hourly bar graph and shift time frame are updated after the hour/shift has passed.
The Current Shift dashboard is just one feature out of many that MachineMetrics offers. It represents a great starting point for manufacturers that are looking to kick off their digital journey and begin the process of using automated data collection to drive value on the shop floor.
The powerful information on the performance dashboard tiles helps operators and managers understand at-a-glance what is happening at each machine, while the detailed information on the tiles and the shortcuts to additional data provide real-time insights that can be used to drive action. Operators who are assigned to a machine often will work harder to ensure their machine doesn't fall behind their goals and their peers. This transparency alone can improve performance by over 10%.
Supervisors walking the shop floor can use the manufacturing dashboard to quickly identify where time should be spent. By the time you get the data you need from a traditional ERP system, it's too late to take action. The real-time information displayed on the dashboard bridges this communication gap between operators and managers, allowing both to be more proactive.

Ready to empower your shop floor?
Learn More

.png?width=1960&height=1300&name=01_comp_Downtime-%26-Quality_laptop%20(1).png)


.gif)


Comments