
Book a Demo of MachineMetrics
The leading platform to collect, monitor, analyze, and drive action with machine data. Set up time with a product specialist to learn how we can help your operation.
Ready to empower your shop floor?
Learn More.svg)

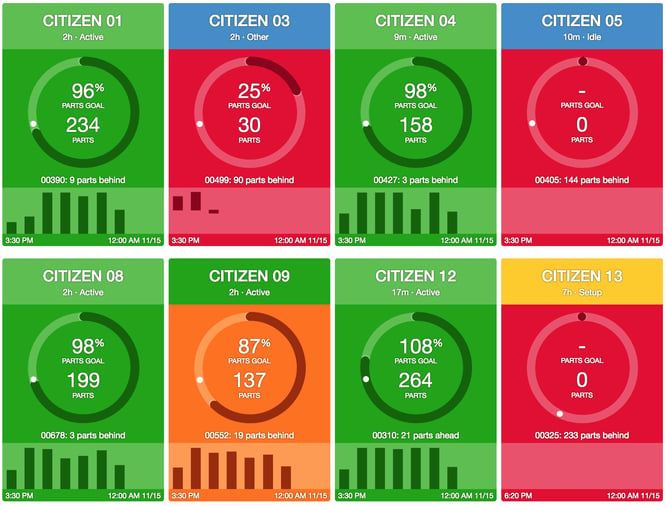
You might have noticed a colorful new look to our shop floor dashboards. After hearing feedback from our customers, we realized that the subtle status circle just wasn't large enough to be seen at a distance. Now the color of the entire top section of the tile represents the current machine status, while the rest of the tile's color represent's the current shift goal. We are also displaying actual fault messages, and downtime reasons on each tile. Here is an example dashboard with the changes. We would love to hear your feedback!
Some other changes with this release include:
Ready to empower your shop floor?
Learn More

.png?width=1960&height=1300&name=01_comp_Downtime-%26-Quality_laptop%20(1).png)


.gif)


Comments