
Book a Demo of MachineMetrics
The leading platform to collect, monitor, analyze, and drive action with machine data. Set up time with a product specialist to learn how we can help your operation.
Ready to empower your shop floor?
Learn More.svg)

A manufacturing company is only as good as its manufacturing equipment. But more importantly, how well the organization uses its equipment. Without knowing the overall equipment effectiveness (OEE) of production machines, companies risk losing ground in a hyper-competitive manufacturing environment.
By capturing and analyzing (OEE) data, users can better understand how effectively their equipment is being used, which is incredibly important given the large capital expenditure that equipment represents.
An overall equipment effectiveness dashboard can display not only the real-time overall equipment effectiveness of a shop floor but also identify trends, patterns, and paths for improvement, giving manufacturers a chance to improve efficiency as part of their continuous improvement initiatives.
Overall equipment effectiveness (OEE) is a critical metric that measures what percentage of production time is effective. OEE data is collected from metrics on performance, quality, and availability to develop dynamic scoring that helps manufacturers assess effectiveness and optimize processes.
By optimizing these three variables, your operation becomes more cost-effective and efficient. It also provides data that improves decision-making within the operation.
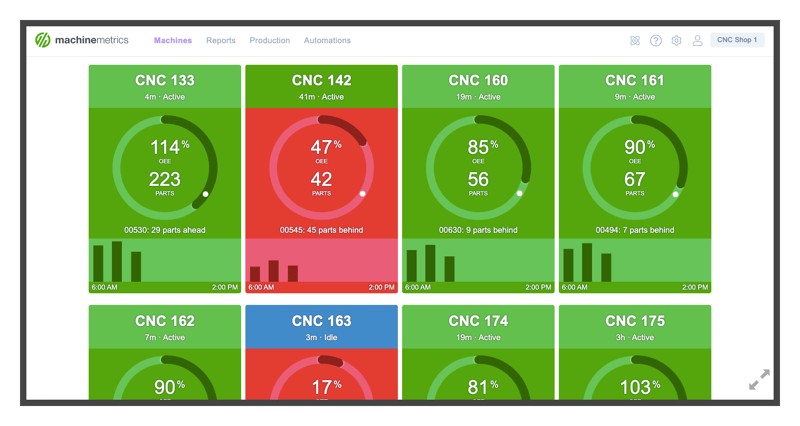 An dashboard from MachineMetrics shows equipment performance against pre-defined goals.
Overall Equipment Effectiveness (OEE) is defined as the amount of time a manufacturing machine is truly productive. It combines three distinct metrics - availability, performance, and quality - to achieve a score representing a machine's actual productive time. This helps operators, technicians, managers, and upper management make better decisions for optimized performance.
By displaying these conditions as an Overall Equipment Effectiveness dashboard, HMI, or remote terminal, end-users can analyze various factors such as shift or machine type. They can also look at operational efficiency across many machines, analyze effectiveness between operators, or look at the entire factory at a meta-level.
These digital manufacturing dashboards allow contextualized human-centric data to be added at the point of use. In addition, they can be used with other analytics dashboards to review data side by side for informed decision-making, whether you are on the shop floor or back office.
There are many benefits to using overall equipment effectiveness data in manufacturing. These include:
In traditional manufacturing, not all processes were planned; some grew organically as the business scaled. Overall equipment effectiveness helps managers identify what areas of a production process need improving.
An overall equipment effectiveness score provides solid data to trigger process improvement and optimization. Or, it may identify training issues and a need for more consistent process steps from shift to shift. Another indicator may be plant layout or setup and changeover procedures.
An overall equipment effectiveness score provides solid data to trigger process improvement and optimization. Or, it may identify training issues and a need for more consistent process steps from shift to shift. Another indicator may be plant layout or setup and changeover procedures.
OEE helps identify where quality issues arise in production to reduce waste and improve quality. This process is especially effective when insights are generated in real time.
Waste can result from quality failure, operator performance, and availability losses due to machine breakdown or planning. OEE data provides visibility into all these areas so waste reduction strategies are data-driven across several fronts.
A lot of machine downtime comes from day-to-day operations. This downtime reduces availability, a critical component of OEE data. Overall equipment effectiveness can be leveraged to reduce the common short stops and idle in a manufacturing operation.
These insights help manufacturers identify areas for intervention for chokes, jams, and other short-stop events. It also helps them respond to idling, whether due to inventory not being staged promptly or having to wait on technicians. OEE data empowers managers to reduce availability losses like these.
OEE reveals production performance by shift, machine, department, or across the shop floor. Using real-time OEE data means scores are unbiased and precise. The data facilitates better communication among workers and managers, facilitating greater collaboration as they work toward process improvement as a team using a single version of truth.
OEE also provides insights for change management, workflows, change orders, and design changes requiring approval. Companies can eliminate omission, bias, and miscommunication by removing error-prone manual documentation and replacing it with automated workflows, digital document approval, and more.
Overall equipment effectiveness data lets managers implement maintenance strategies that impact productivity. This strategy improves quality and reduces availability losses as machines have more uptime. It also improves performance as service and repair are better coordinated and equipment health is optimized.
This process also changes the maintenance mindset from "maintenance as overhead" to one where maintenance is considered a vital part of the production process. Machine health and upkeep become part of improving each machine's effectiveness.
An overall equipment effectiveness dashboard can help operators and managers understand their performance in real time. It can contain several data types to support this visualization and provide context that helps workers decide what action to take and why.
To understand how to calculate OEE performance, you will need access to key data. Data captured and analyzed in an overall equipment effectiveness dashboard includes:
By allowing users to quickly review factors such as downtime, production, and other variables, insights affecting quality and efficiency can be consumed at the point of use. And action can be taken immediately to resolve issues or prevent them altogether.
Here are several areas where an overall equipment effectiveness dashboard is required:
An overall equipment effectiveness dashboard allows companies to track OEE over time. Human activity in machine operation can impact quality, downtime, and operational efficiency. Using OEE dashboards and reports to track performance over time means that managers can look at different levels of OEE by the hour, shift, day, week, or any other time frame desired.
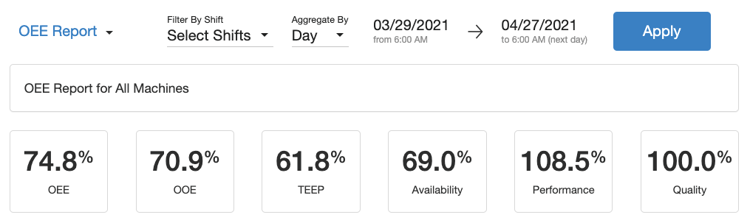
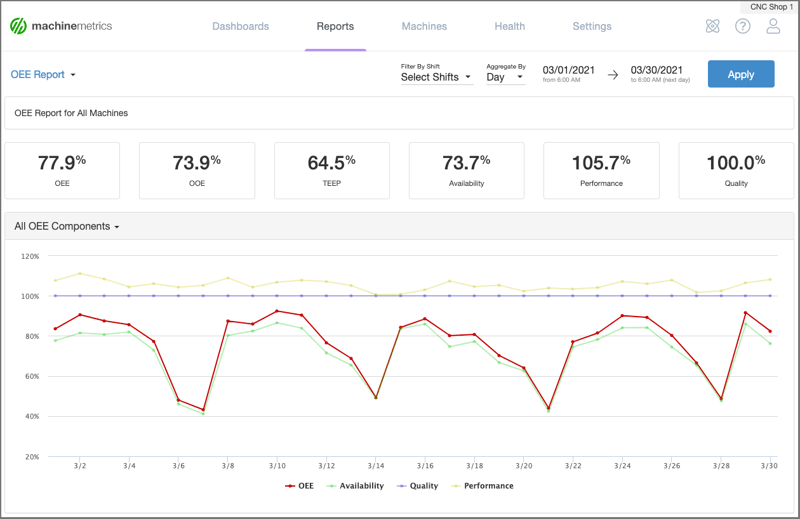 A MachineMetrics OEE Report displaying key metrics as well as historical OEE performance.
Low OEE on any of these periods can help managers understand downtime reasons, better direct maintenance departments, and optimize manufacturing processes to significantly improve their OEE. Because production is enormously complicated in any manufacturing company, the capability to monitor OEE graphically or through an OEE report can make a big difference in improving performance.
Robust machine data platforms like MachineMetrics allow overall equipment effectiveness dashboards to be used alongside other dashboards to transform insights such as performance, parts goals, and other critical metrics. The insights delivered are more accurate than human-centric metrics.
This functionality is built into the dashboard view and enhances users' decision-making. Users can quickly select between OEE and other dashboards quickly. They can also zoom in to a detailed view or out to a high-level view of machine groupings or the entire factory.
This can be helpful for identifying areas of opportunity and learning how to calculate OEE performance for under-utilized equipment, excessive downtime, or bottlenecks in production processes.
Machine performance can be color-coded on all metrics to keep operators up to date on progress toward established goals. This can help encourage healthy operator competition. Simple color schemes of green, orange, and red allow further visual cues and display OEE data in real-time.
The days of running manual time studies are long gone. When data is acquired in real-time, the need to manually capture run time, changeover time, and other information is eliminated.
Human-centric data is also error-prone, so even if the time is captured, the reason may be misunderstood or biased based on the perception of the recorder. By capturing data using sensors and devices, the need for human input is significantly reduced except in cases where it can be added to the automated data capture in the form of contextualization.
This process drives the best use application where some human-added data is optimally captured for context issues while leaving the absolute data capture to embedded sensors and devices.
OEE can be used effectively as a benchmark for measuring progress. OEE score is calculated by multiplying its three elements:
OEE score is calculated by multiplying three elements together, Availability, Performance, and Quality. The calculation for the individual elements are:
The simple calculation for OEE is:
Or combining the calculations of the three elements:

There are several dos and don'ts associated with overall equipment effectiveness dashboards.
MachineMetrics is a robust, best-in-class system for collecting, standardizing, and taking action on production data. Out-of-the-box reports and dashboards, such as real-time OEE dashboards. These dashboards are accessible at each machine, above the shop floor, and in back offices.
Using the OEE manufacturing dashboards from MachineMetrics, operators, technicians, and managers have access to customizable and configurable data that optimizes and streamlines operations. This real-time information is analyzed to gather insights that can be immediately used to take action.
The system is flexible, allowing C suite execs and factory floor operators access to the same information simultaneously. This means companies can use these dashboards to make both tactical and strategic decisions, with everyone operating with a single version of the truth.
Ready to empower your shop floor?
Learn More

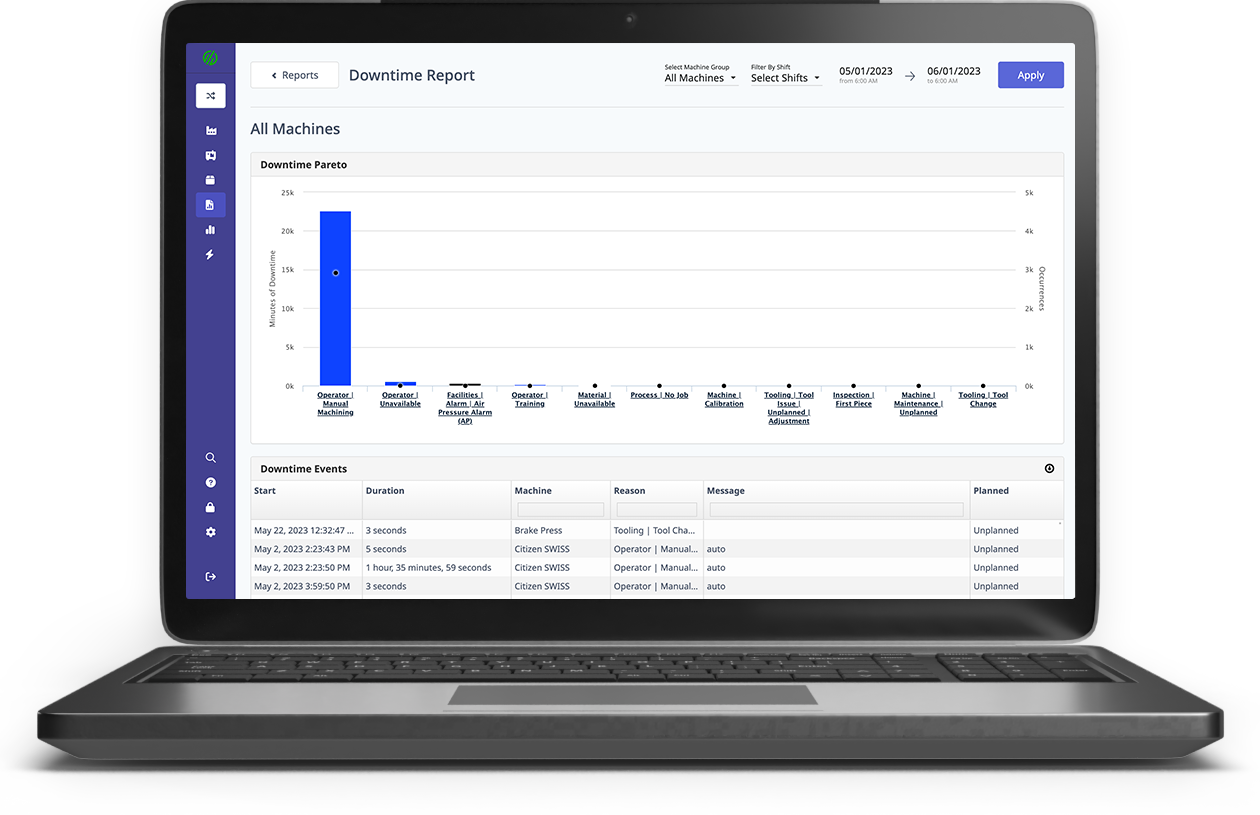
.png?width=1960&height=1300&name=01_comp_Downtime-%26-Quality_laptop%20(1).png)


.gif)


Comments