
Book a Demo of MachineMetrics
The leading platform to collect, monitor, analyze, and drive action with machine data. Set up time with a product specialist to learn how we can help your operation.
Ready to empower your shop floor?
Learn More.svg)

Originally published on Towards Data Science
Over the last few months, we’ve been quietly monitoring and discovering new use cases for our predictive machining product. Thanks to a streamlined operator interface, which also conveniently doubles as a “behind the scenes” labeled-data collection platform, we’ve seen hundreds of tool failures, bearing failures, and other machine failure scenarios thus far.
In concert with our customers, we’ve come up with a large catalog of what typical machine failures look like from a motor-data perspective, which we’re excited to share with you today. We’ll review six scenarios we’ve seen repeated across multiple customer sites, and what they look like from both a “points on a graph” perspective and their physical manifestation on the shop floor. These are as follows:
Before we get to the good stuff, let’s review our thesis for our predictive machining offering:
We extract rich data from embedded sensors on the machine to predict and prevent different scenarios that could prove costly.
Just to review, at every single MachineMetrics machine, we have an operator tablet, which is basically just a Samsung Galaxy tablet or iPad pointed to the particular machine’s webpage in our SaaS product.
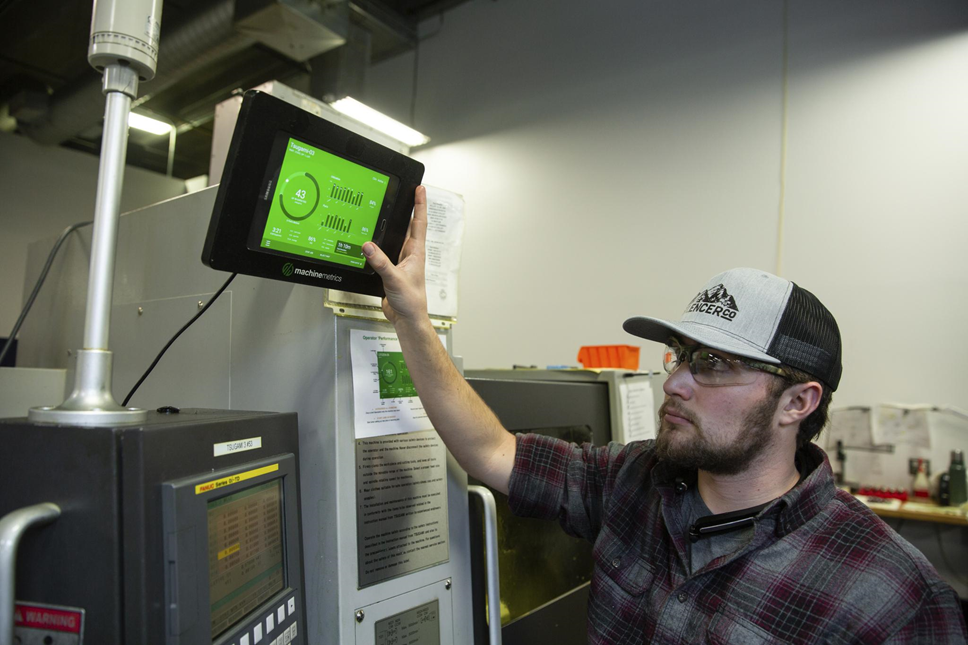
A customer using our operator tablet.
The operator tablet is directly connected to our platform, so whenever the machine stops, a signal is sent from the machine to our Edge device, which is then sent up to the cloud where it’s aggregated and dashboarded with other metrics. The tablet then reflects this new information and issues a popup on the machine webpage prompting the operator to explain why the machine went down.
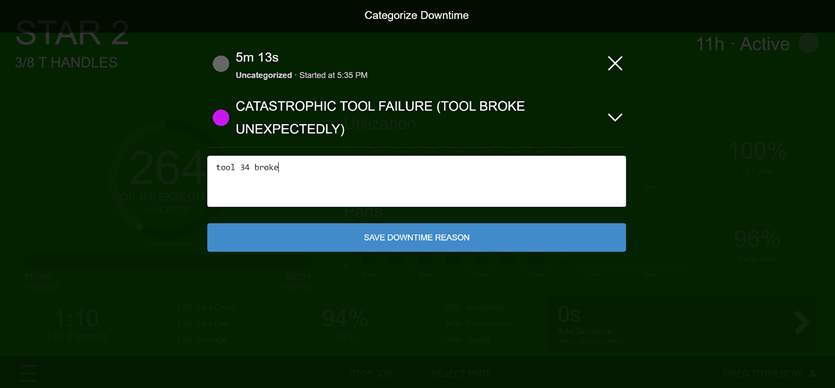
When a machine stops, a popup appears asking the operator to add a reason code.
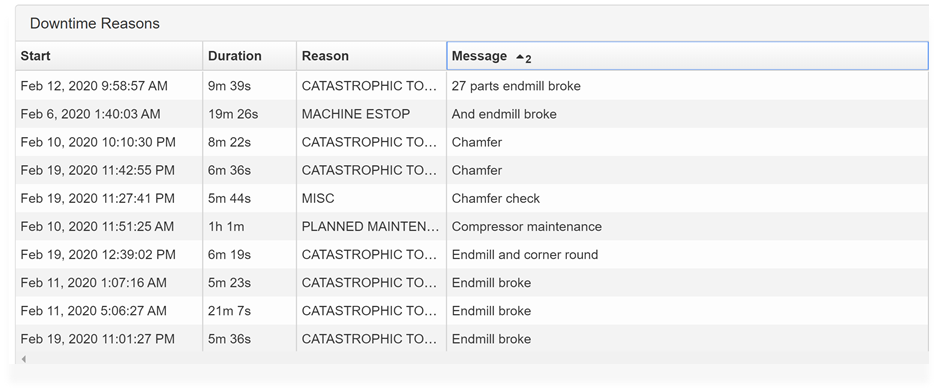
Over time, these annotations accumulate, allowing us a rich, detailed view of when and for what reason a machine broke down.
It’s up to MachineMetrics Data Science to come up with the why and how of the machine breakdown, using the extremely fine grained data we collect from the machine’s motors. In one embodiment of this, we can look over tens of thousands of parts made and dozens of annotations to identify patterns, as in the below example, where black lines are annotated failures and dots are the power consumed by each part made.
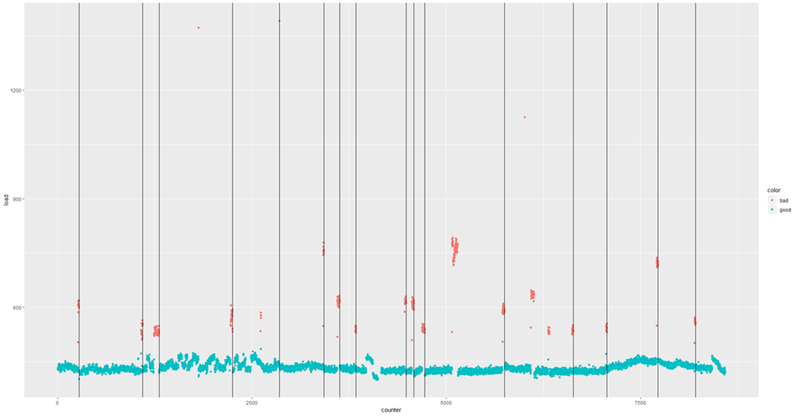
Black lines are annotated failures, while red dots are abnormal load. Some red dots don't line up with black lines, due to the fact that annotations are sometimes missed by operators.
Over time, patterns emerge for each type of failure. The black-lines in the plot above all represent times of endmill failures, where a particular endmill breaks and cannot do the work required to finish the part. The tool that comes in after the endmill then needs to expend additional energy to make its cut, causing the elevated load signature in red you see in the plot above. This is repeated time and time again, allowing us to create a simple thresholding algorithm to stop the machine in its tracks whenever we see the first elevated load signature.
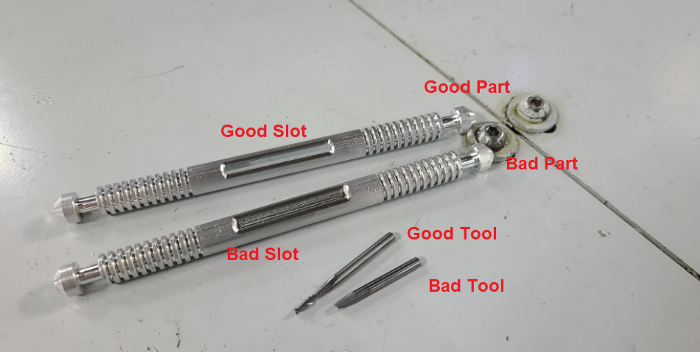
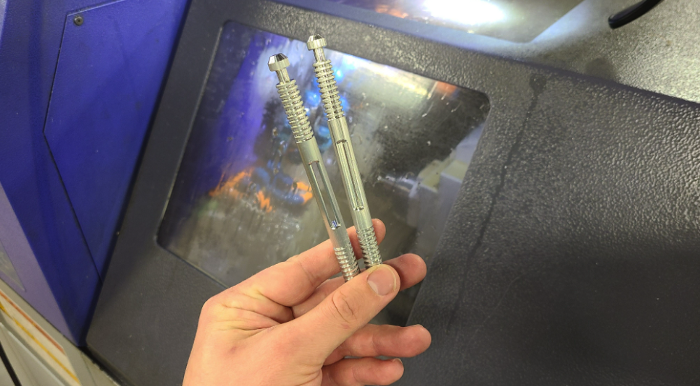
In its physical manifestation, you can see that a good part, cut by a good endmill, has a nice and shiny finish in the slot. A bad part, cut by a broken endmill, has a rough slot because the endmill was not able to create a smooth finish, and the tool that came afterwards wasn’t able to do its job correctly either.
And in our product, we now monitor the loads on this machine to issue a feed-hold before any of these Bad Slot Parts are made. Over the last 4 months, we’ve issued 60 feed holds on multiple machines, with 3 false positives and 2 missed failures (95% precision, 96% recall), preventing over 2,000 scrap parts from being made and saving countless man hours of machine reconfiguration. Oh, and just to be sure, these are small parts, being made by small tools — size isn’t much of a constraint for us when we’re pulling very sensitive motor data. All parts coming out of these machines are now shiny and new, without the defects they once used to carry.
Pretty neat, huh? That’s just one of many use-cases. You didn’t think we were just a one-trick pony, didya?
Similar to endmill failures, bearing failures can prove costly both in terms of materials and in manpower.
Dissimilar to endmill failures, bearing failures look completely different in terms of what patterns we need to look for.
Similar to endmill failures, bearing failures use the same type of rich motor-data and collection methodology.
Dissimilar to endmill failures, bearing failures manifest over long (days to weeks) periods of time and can be prevented long beforehand.
Let’s first investigate what load on the machine does moments before a bearing failure, in a snapshot of data 2 hours before failure.
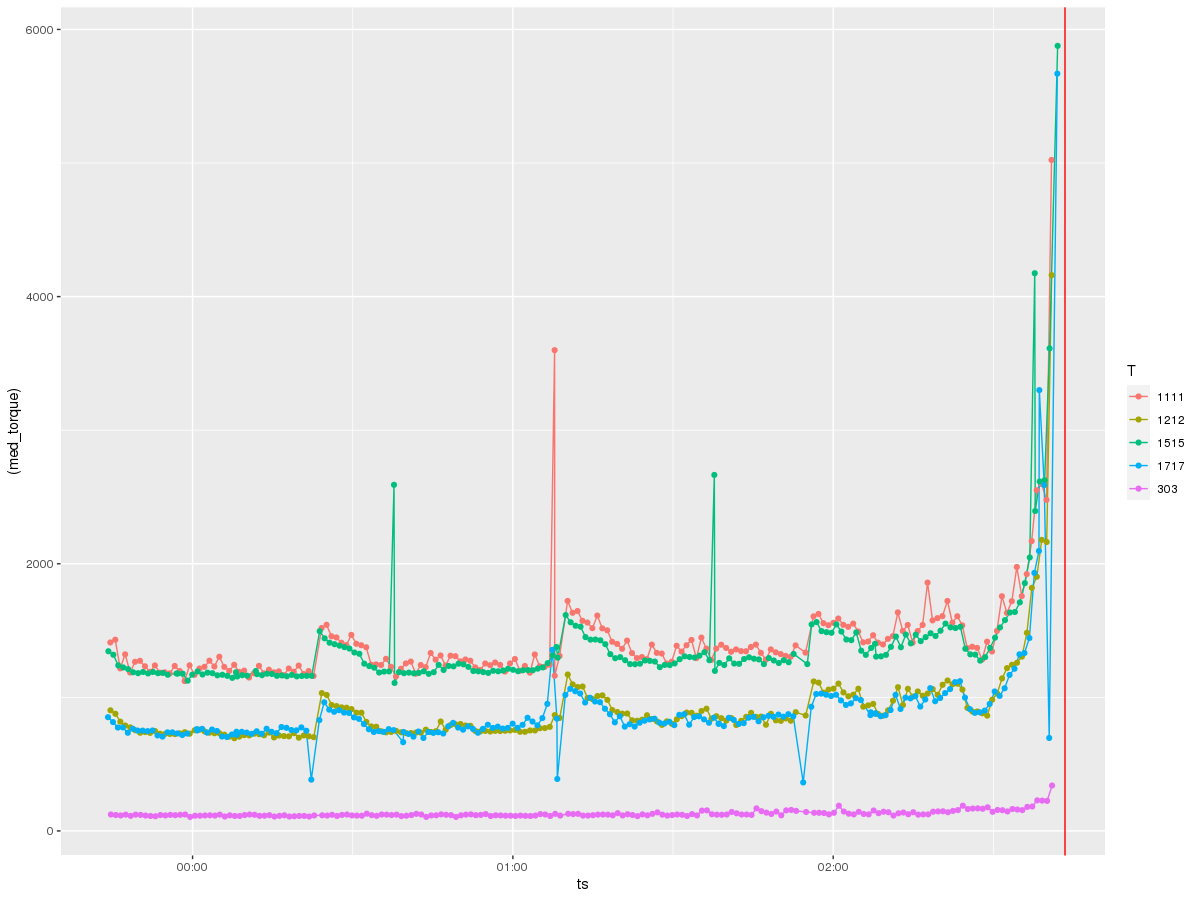
Each one of those lines is load on a particular tool. It doesn’t take a rocket scientist to figure out what’s going on here. Load skyrockets ~15 minutes before the actual bearing failure on every single tool, likely due to the fact that the machine is experiencing additional strain from an increasingly compromised key component.
If we look at the part-by-part progression in the 15 minutes prior to failure, another interesting pattern emerges, which is that the load appears to degenerate over time. You can see that for each cut, the load goes exponentially more and more out of spec.

Compare this to another bearing failure on another machine making the same part, and the patterns are remarkably similar. That’s because this is the unique signature for a bearing failure. While endmill failures leading to scrap parts exhibit a jump in load on the subsequent tool, bearing failures exhibit a greatly degenerate increase in load on all tools.
 |
 |
And looking at this over time, we actually see that this degeneration starts days before the actual failure. On two separate instances for two machines, you can see that there’s an elevation in load long before the final steep climb during the last 15 minutes before breakage. That’s because a bearing doesn’t just go out of nowhere. There is likely a loosening or fracture that goes unchecked for days prior to the final hari-kari, brought on by misuse or lack of maintenance. In this case, the failed bearing also caused spindle housing damage, which cost another cool couple of thousands of $$$ in repair.
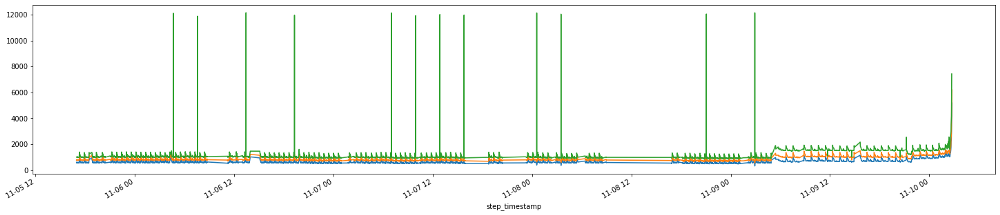
November bearing failure, showing elevated load ~2 days beforehand. [View full size image]
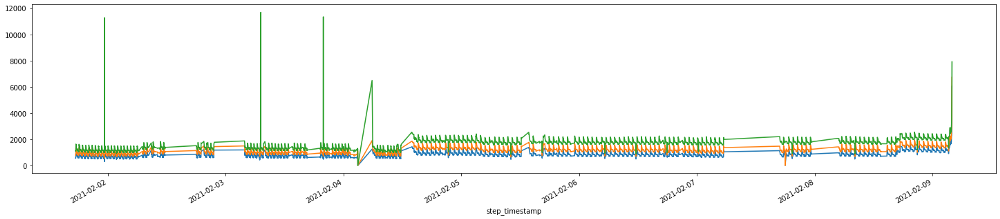
February bearing failure, showing elevated load ~1 week beforehand. [View full size image]
The remarkable consistency we see for similar types of failure is due to the fact that we are looking at physical phenomenon, which are, surprise surprise, governed by the laws of physics. Thus, failures follow deterministic patterns that we can discern from sufficiently high-fidelity data. The trick is really in getting this data and cleaning it to be useful, which is a large part of our IP.
We credit this innovation to the particular mix of skillsets we have on the MachineMetrics team — we don’t believe it’s typical to have seasoned machine operators working with experts in cyber-physical protocols, supplemented by physicists from CERN and data scientists from global thinktanks, all backed by investors who believe we are ushering in a new age of industry.
Having an entire column of tools break can be a frustrating experience for any machinist. Unfortunately, this is an all-too common occurrence in our industry. What if we could see when the first tool broke, and then stop the machine immediately before the other tools get taken out?
Turns out, you can. After the first tool goes, the change in load signature on subsequent tools is all but handed to you on a platter.
In one instance of this, we see the first tool break many part cycles before the machine stops itself when it detects something catastrophic. By the time the self-stoppage occurs, other tools have also been taken out, costing the shop hundreds of dollars worth of unnecessary tool replacements. The first tool likely broke because it was worn out and past end-of-life, so it probably couldn’t be saved anyways. But there’s no reason why other tools after it, some freshly replaced, need to go too.
You can see an animation of this below, where the purported tool failure according to the operator, and when the machine stopped itself, was at Part 40. In fact, the signal starts to degenerate around Part 37, a full 3 cycles before the machine self-identified that something was awry. During these 3 cycles, the tool that followed the broken tool went bust.
Let’s break this down tool use period in addition to just part number — tools are designated by different linetypes.
Let’s zoom into the troubling region a bit. It’s a little hard to pick out, but it looks like T101 is the offending tool that broke, and T117 is the one that experiences a higher load in the cycles immediately after, then flatlines (dies). Once the tools are replaced, the load signature goes roughly back to what it was before (accounting for a bit of slippage due to having fresh tools).
The annotation in this case was “H1t1 198/200 rougher broke, took out seat.” — meaning, “head 1, tool 1, the roughing tool, broke during the job, at 198 out of 200 parts intended to be made, and took out the seating (subsequent) tool”.
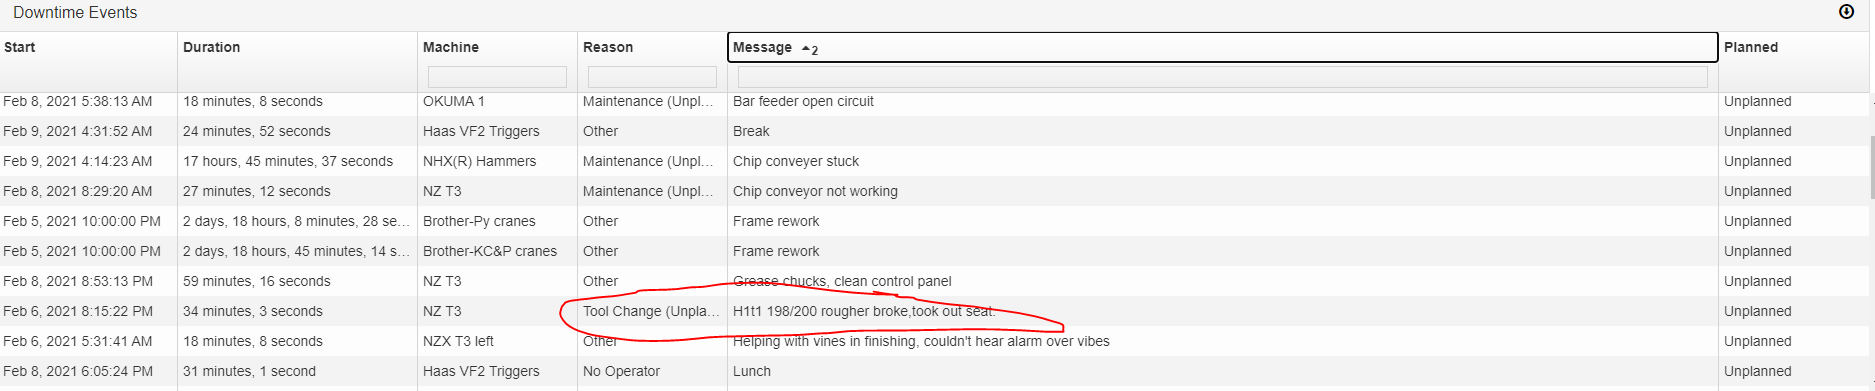
Indeed, that is what happened.
Stay tuned for Part 2, where we’ll review tool life estimation, the consequences of incorrect offsets on your machine, and incomplete cutoffs from tool failure.
Featured image courtesy of Daniel Smyth.
Ready to empower your shop floor?
Learn More

.png?width=1960&height=1300&name=01_comp_Downtime-%26-Quality_laptop%20(1).png)


.gif)


Comments