
Book a Demo of MachineMetrics
The leading platform to collect, monitor, analyze, and drive action with machine data. Set up time with a product specialist to learn how we can help your operation.
Ready to empower your shop floor?
Learn More.svg)

As with any complex mechanical device put to intense day-to-day use, CNC machines experience repeated downtime and require various forms of upkeep and human intervention to keep them running. From routine part changes and standard preventative maintenance, to unexpected complications such as internal computer issues and mechanical breakdowns, each individual machine will exhibit its own idiosyncratic sequence of downtime events over the course of days, months, and years of operation. These are often expensive events in multiple respects, costing valuable production time, valuable operator time, and possibly incurring high repair/replacement costs. The downtime history of each machine becomes a key factor in understanding overall machine health and predicting future downtime and performance.
Fully harnessing this information requires obsessive and very consistent record-keeping. Traditionally, this latter task has fallen to the operators, whose time and attention would be more productively directed toward running and maintaining the machines than toward painstakingly recording and organizing reasons for downtime. However, with advances in IoT, dense, detailed machine behavior can now be electronically monitored and recorded across a multitude of data streams. This opens up the possibility of supplementing or even replacing human record-keeping of downtime events with automated systems. This could take the form of a recommendation system of downtime reasons for the operators, or even of a completely autonomously-generated layer of downtime annotations.
The data pulled off of the machines is incredibly rich, but its raw form is a far cry from the level of interpretability that we need. Understanding what the machines are telling us requires, in effect, learning the language in which they are speaking.
MachineMetrics is in a unique position to accomplish this ambitious task. Over the past half-decade, we have collected thousands of machine-years worth of data from a variety of different machine models, and data collection continues to grow rapidly as new machine shops adopt our platform.
Crucially, the alarms that we get automatically from our machine-sourced data come married with downtime event annotations entered through our app by the operators. So if a downtime event in our database is annotated by the operator as “broke down due to shattered tool,” we are aware of that event, the stream of alarms, and the machine behavior leading up to it. We can therefore try to leverage various machine learning algorithms to associate particular patterns of machine data to particular types of downtime annotations. The process generates predictive models that can be carried forward to allow for semi-automated or fully-automated classification of future downtime events, and a more consistent, more informative record of each machine’s history. Ultimately, this relieves the load on operators and allows shop owners to gain more effective visibility into downtime causes.
Our initial explorations have focused on the “native language” of the machines as represented by their manufacturer-specified electronic alarm codes. Many classes of downtime events are found to be associated with some preceding sequence of alarms, even from just a cursory visual inspection of the data time series. For example, here is a sequence of alarms that occurred over the course of about two minutes on one machine, leading up to a broken drill bit.
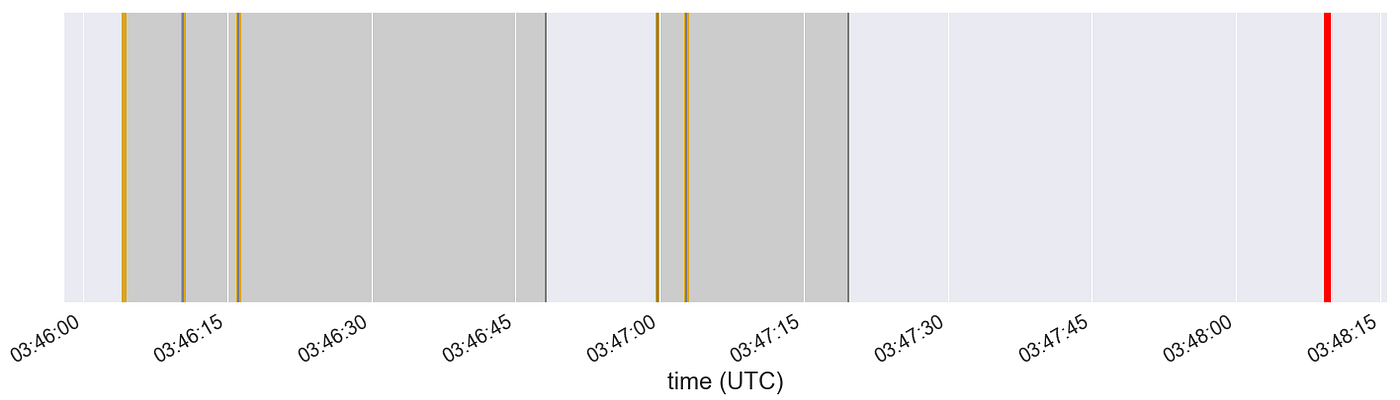
The gold stripes indicate when each alarm switched on, and the dark regions indicate when at least one alarm was still active. The red stripe indicates the time when the machine stopped.
To make a more detailed postmortem, let us look at the leadup to this event in tabular form
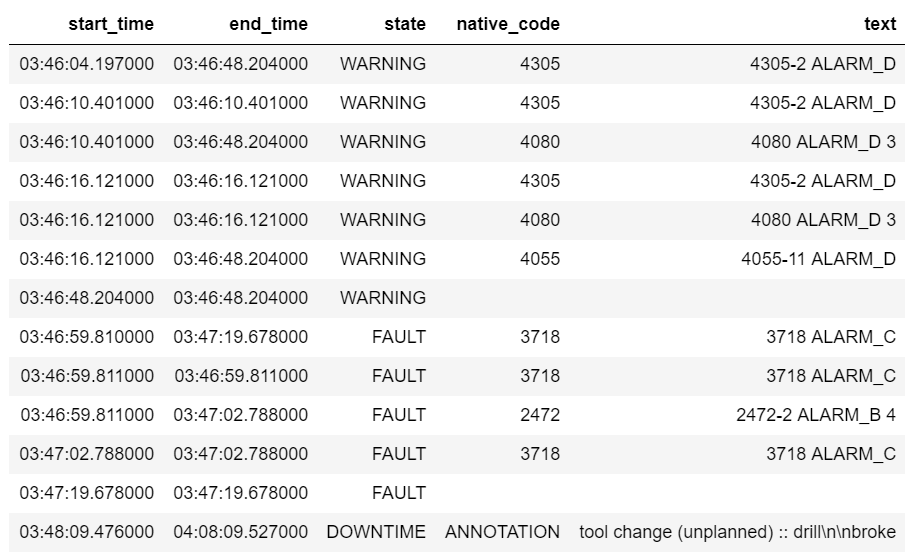
We see a train of WARNINGS, followed by a train of FAULTS, followed by the machine going down for 20 minutes. According to the operator’s annotation, this was due to “tool change (unplanned) :: drill\n\nbroke.”
Going further into the content of the table, the native_code column contains the manufacturer-level alarm codes, and the text column provides further information on the top-level alarm class and (sometimes) sub-classes. Different machine makes have radically different conventions for both the codes and the text.
In this case, no information on the English meaning of the alarms is provided, but this does not necessarily pose a problem. For formulating an automated learning algorithm, it is actually simpler to directly associate these abstract codes with downtime events. This saves us the trouble of, for example, looking up in the manual that 4305 indicates “Y-axis not at turning position,” and trying to teach a computer exactly what that means. It also alleviates us of human bias and problems with getting unnecessarily distracted over specific alarms that we may recognize.
Looking to the operator annotations, a tricky part of the problem turns out to be associating simple, unambiguous meanings of downtime to strings of text that the operators have entered. As expected, even for the same machine issue, the text input into our tablet is highly variable between individual customers, individual operators, and individual events. (Note the seemingly arbitrary line breaks in “drill\n\nbroke.”). Put simply, different people enter annotations in a very different way, due to disparities in domain knowledge, comfort with technology, and desire to use the MachineMetrics system.
Note: The raw data in the table has two alarms that are blank. What is up with those? A careful look reveals that they are perfectly correlated with the end times for preceding alarms. They are effectively alarms whose content is “an alarm just ended” — the machine-language equivalent of a period. This is redundant, since the end time of each alarm is already recorded. There are a large number of blank alarms in the database that serve a similar purpose, and a very tiny fraction that represent data-collection glitches. Since the blank alarms are not informative, we subsequently remove them as a basic step in data hygiene.
Before we have any hope of learning how to classify downtimes using information provided by the machines, we had better learn how to classify them using data provided by the operators. In other words, out of the probably thousands of different fine-grained causes of a machine going down, and the uncountable number of ways that humans can express those causes in English (quickly-jotted and typo-riddled as they might be), can we block off the downtimes into unambiguously-defined categories?
One way to perform this task is by manually combing through all of the downtime annotations and assigning them to categories based on our (hopefully) well-trained human judgement and understanding of the English language. However, our database currently contains almost two million annotated downtime events, so this would take a while.
Automating the task falls into the well-established domain of Natural Language Processing (NLP). We are in the process of building out reliable models of this type for classifying the annotation texts. In the short-term, we have identified a number of keywords that are tightly correlated with a few broad categories of unplanned downtime events, as verified by studying random subsamples of the annotations categorized in our app. These categories are breakdown, coolant, and lubricant. (The first includes the drill break example above.) The method is far from capturing all of the annotations, even within those limited classes, but those that it does capture are known to be trustworthy.
The next step is figuring out which machines to look at. Different machine makes and adapter types effectively speak in different alarm languages, and each of these needs to be learned separately. We start out by picking the make/type that gives us the largest number of cleanly-classified downtimes to study. These are the Okumas running on our MTConnect adapter, representing over a hundred individual machines and about 3,000 downtimes assigned to the above three categories.
Finally, as far as the basic data prep, we need to identify which sequences of alarms belong to each downtime. Many sets of alarms occur in isolation, far from any other alarms or downtimes. For example, zooming out on the broken drill event to include the previous twelve hours, the situation looks like
The entirety of the alarms that we looked at before are now sitting underneath the red stripe that marks the start of the downtime event. Obviously, there are a lot of bursts of alarm activity in the machine before that. While these may be subtly informative of the drill break happening hours later, we will try to keep things simple for now, and weed them out.
How do we do this in a rigorous way? We first cluster the alarms into isolated sequences, according to a fixed time gap threshold. Each annotation is then attached to only the most recent sequence. In this case, the drill break event gets attached only to the alarms that we looked at earlier (minus the blanks).
In order to determine an appropriate time gap for separating out the sequences, consider the distribution of spacings of adjacent alarms. (Note the logarithmic time scale on the plot and minimum defined gap of 1 ms to avoid log(0).)
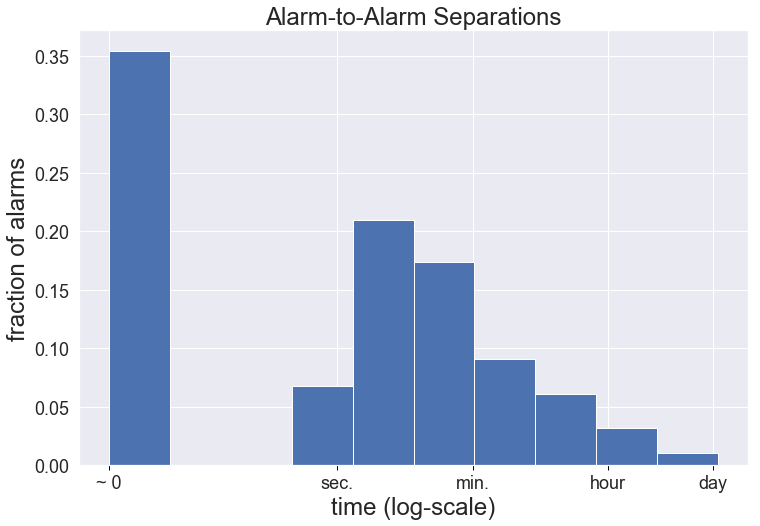
The median separation is about four seconds, and there is a local peak around that time scale. We therefore infer that several seconds or less is a typical separation of alarms within clusters. But the tail is very broad, and a longer time gap would help ensure fewer clusters of alarms being unnecessarily broken apart. Though not immediately obvious in the plot, it is notable that the 90th percentile is a little over seven minutes. We fix ten minutes as a nice, round number for our time gap threshold. The final performance turns out not to be terribly sensitive to this choice.
At this stage, we can collect a set of about 3,000 clean pairs of (annotation, alarm sequence). Looking at just the alarms’ native_codes (and ignoring their text and timestamp information), we would get a big list with entries like this
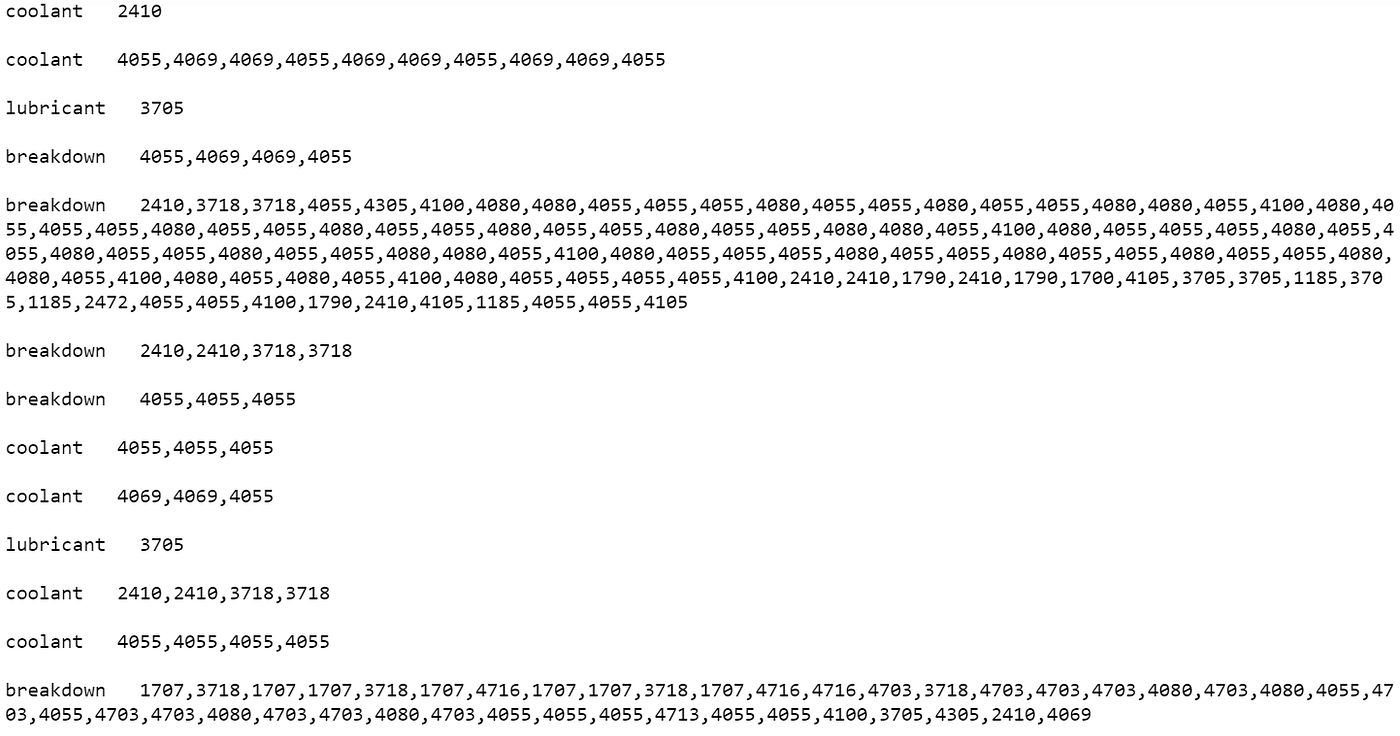
Can you spot any patterns?
Thinking of each individual sequence of alarms as a “document,” we are now faced with a problem that is closely related to classic text classification problems, but where the vocabulary consists of machine alarm codes. (NLP, take two.) A simple, commonly-used strategy then immediately suggests itself: treat each document as a Bag of Words, where we only pay attention to word counts and not their ordering. Since we deal here with alarms rather than words, we might call such a strategy a Bag of Alarms. This highly reduced version of the data then serves as the input into our machine learning models.
A plethora of excellent tools for building and evaluating such models are available for us here. For example, there is a standard trick for weighting the word counts called TF-IDF, which we found to slightly enhance discrimination power. For now, we take the TF-IDF weighted Bag of Alarms counts, and feed them into a multi-class logistic regression model. The final result is a model that, when presented with a new downtime event preceded by a sequence of alarms, will try to make an informed guess about which category actually occurred and can suggest this to the operator in the downtime popup.
Now, we do not expect this model to be perfect, but we would at least hope that it is better than randomly guessing. Indeed, hopefully it is closer to perfect than to random. But to assess that, we need a procedure for gauging the model’s performance.
To do so, we employ another standard trick: cross-validation. The data is randomly broken into ten chunks. We retrain the model on the combined data from nine of those chunks, and then check the predicted annotations of that model against the true annotations within the remaining chunk. This procedure is repeated ten times, each time holding out a different chunk for testing. The combined list of pairs of (true annotation, predicted annotation) then gives an approximate picture of how the model will perform on genuinely new data.
As a set of metrics to evaluate the model, we compute the fraction of events within each true annotation class that the model classified within each predicted annotation class. So, for example, for breakdown, how many were (correctly) classified as breakdown, and how many were (incorrectly) classified as either coolant or lubricant. Together, this list of lists defines a confusion matrix. The confusion matrix for the Bag of Alarms / TF-IDF / logistic regression approach is

For reference, a perfect model here would just be the unit matrix (1’s on the diagonal, 0’s otherwise). Random-guessing would be a matrix uniformly filled with 0.3333…’s. Clearly, we are somewhere about halfway in-between. And it appears that some confusion channels are nearly absent. (E.g., breakdown and lubricant are very rarely confused for one another.) Not bad for a naive, more or less out-of-the-box model!
This result is very encouraging. It means that there is information about the downtimes encoded in the alarm patterns, and that we can already start to access that information at the level of a first exploratory exercise.
The analysis presented so far is really just the few first steps. There is a huge amount of information about the alarms (timings, durations, text content) that we are currently throwing away, never mind that there are many other data streams (temperature, load, etc) that we have yet to tap into. The options for applying powerful, sophisticated models using this rich data are nearly unbounded. Work also continues apace on developing a complete model for mapping the operators’ English-language annotations into consistent categories. And then there are all of the other machines in the database, with a number of other unique alarm languages and data streams.
Our short-term goal is to use the data to automatically establish the most important annotation categories for each machine make directly from the alarm patterns, and to assign these categories human-interpretable labels. These data-derived categories will then exhibit tight correlations with alarm patterns by construction, allowing for even more reliable models and further avoiding human biases. In production, these models should be sufficiently accurate to advise operators with a recommendation engine. After collecting data on how often operators take our recommendations, we can take these as further labeled information to refine our system to be even more accurate.
Stay tuned for further developments!
Ready to empower your shop floor?
Learn More

.png?width=1960&height=1300&name=01_comp_Downtime-%26-Quality_laptop%20(1).png)


Comments