
Book a Demo of MachineMetrics
The leading platform to collect, monitor, analyze, and drive action with machine data. Set up time with a product specialist to learn how we can help your operation.
Ready to empower your shop floor?
Learn More.svg)
Announcing..
The inaugural, limited-edition release of the MachineMetrics 8-track, full of beats straight from the P.L.C.!
In our last blog post, we likened high-frequency data to being able to hear the complete symphony of notes from the machines. We recently discovered that our metaphor wasn’t far off…we can quite literally hear the sounds our machines are making through the raw PLC (programmable logic control) data we’re collecting, without any microphones. Using methods from digital signal processing, these are some examples of pure machining sounds we extracted. Feel free to poke around here.
This is “noteworthy” 🥁, as one of the most common refrains we hear from operators is that before a machine fails, there are auditory cues they can listen for that indicate something wrong with its operation.
In the early days of MachineMetrics, we tried using MEMS microphones installed inside the cabinet of the machine tool, combined with deep learning methods to replicate the ear of the operator, but our experiments were ultimately unsuccessful because of interference from other noises in a machine shop. A real, live machine shop is a highly heterogeneous environment and subject to all sorts of hecticness and hullabaloo.
To get around this, we propose an approach where we don’t use any external sensors. Our current advancements in research have brought us to a point where we can create an analog to sound with just the PLC data, allowing us to extract the pure, unadulterated sounds of machining without factory noise.
In essence, we discovered a technique that can extract the latent harmonics on the load and spindle speed data we’re getting from the PLC, with the result that we “hear” the machine through just these two signals. In this piece, we’ll go over how we did this and some of the implications for industry.
Why Start With High-Frequency Machining Data?
Machine controls must maintain an accurate real-time picture of the machining process in order to properly function and to keep their operators appropriately informed. To that end, the controls are sent continuously-updated signals generated by sensors embedded (pre-built) in the machines’ spindle and axis motors. We characterize this data as “high-frequency,” which simply means that it represents a stream of digitized signals that is coming in so fast that it appears continuous to us humans, just like an audio or video stream over the internet.
The fact that this extremely rich data is directed through the control means that it’s possible to capture it with no additional sensor installations. This has incredible consequences for scalability, as
This no longer requires the integration overhead involved with putting sensors on
Our sources of data are standardized — not subject to variance in sensor positioning, obfuscation, etc.
Upgrades to our algorithms can be delivered over the cloud, via a remote software push
The high-frequency data can be analyzed using a suite of modern software tools and algorithms, allowing extremely detailed monitoring of machining quality.
For certain control types, MachineMetrics currently taps into high-frequency data streams using its existing plug-and-play edge hardware. High-frequency machining data can then be captured using a simple software upgrade, as detailed in our last blog post.
As an illustrative example, let’s look at the main spindle speed and load signals for a vertical mill that was machining automotive parts:
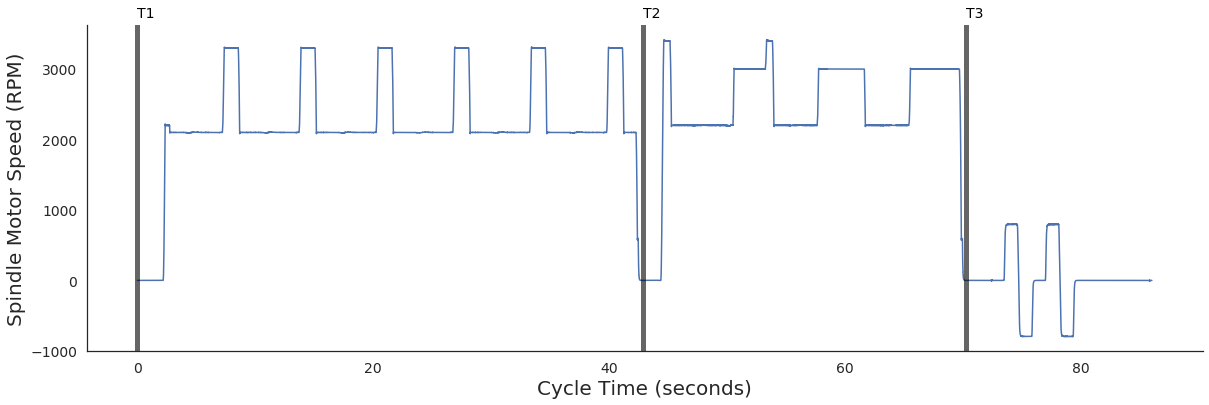
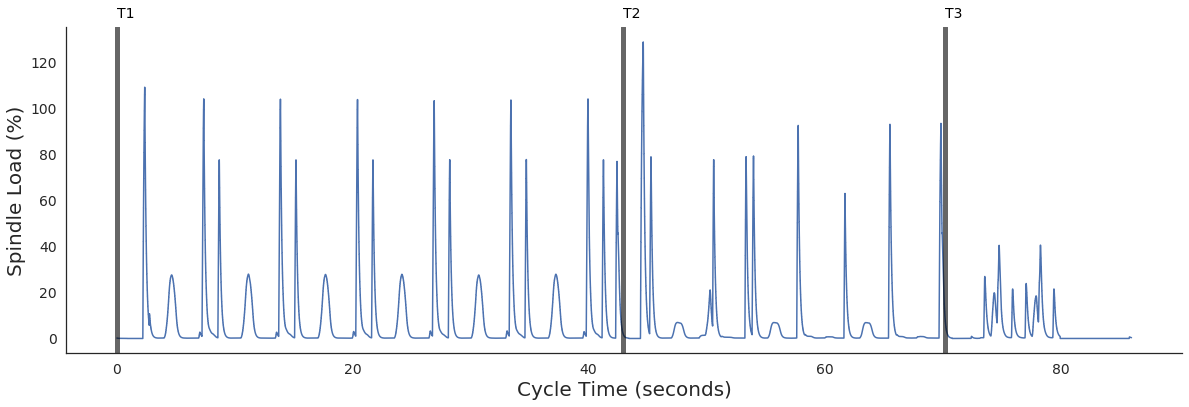
To add some context to the raw signals, we selected a single representative part cycle, and overlaid the boundaries between different tool use periods. Both in-pocket tool number and ATC (automated tool changer) tool swaps are also detectable through our edge device’s connection to the control, so that we can meaningfully track which tool is engaged at which time. (The raw signals could even be investigated according to individual machining operations, by folding in the additional machine data that we record, but that is a topic for future posts!)
We can get a quick idea of how sensitive this data is by looking at one of the tool swaps between the spindle and tool magazine. While the speed plot above covered a range of thousands of RPM over a period of 80 seconds, we zoom in to a range of just a few RPM over a period of two seconds.
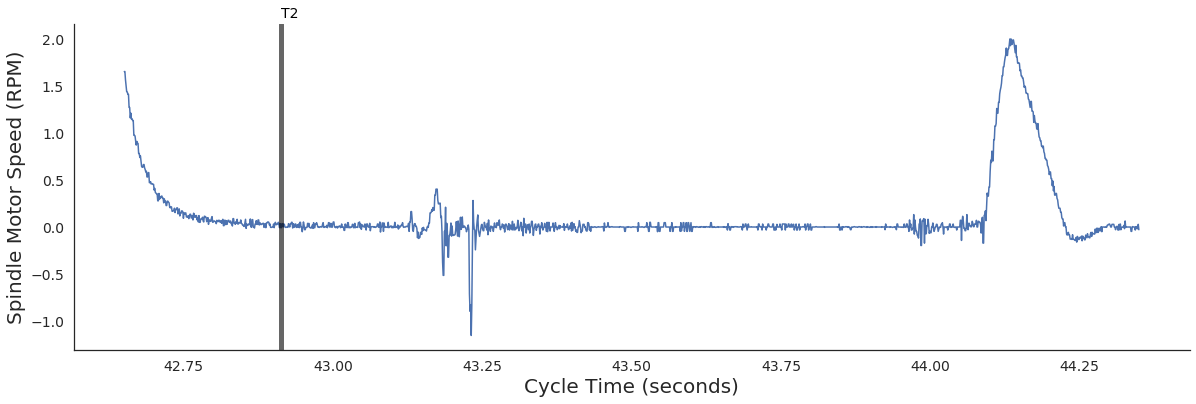
What we are looking at here is the spindle first coming to a complete stop, followed by the command to swap in T2 (vertical line), then some jitters in the spindle orientation as T1 is removed, and finally a tiny spindle rotation as T2 is settled into place.
 A visual representation of the above. Courtesy CNC Training Centre.
It is this fine-grained level of detail in high-frequency data that allows us to probe for extremely subtle effects that may affect machining quality.
The Music in the Machine
Zooming in even further on the spindle speed plateaus reveals one such subtle effect.
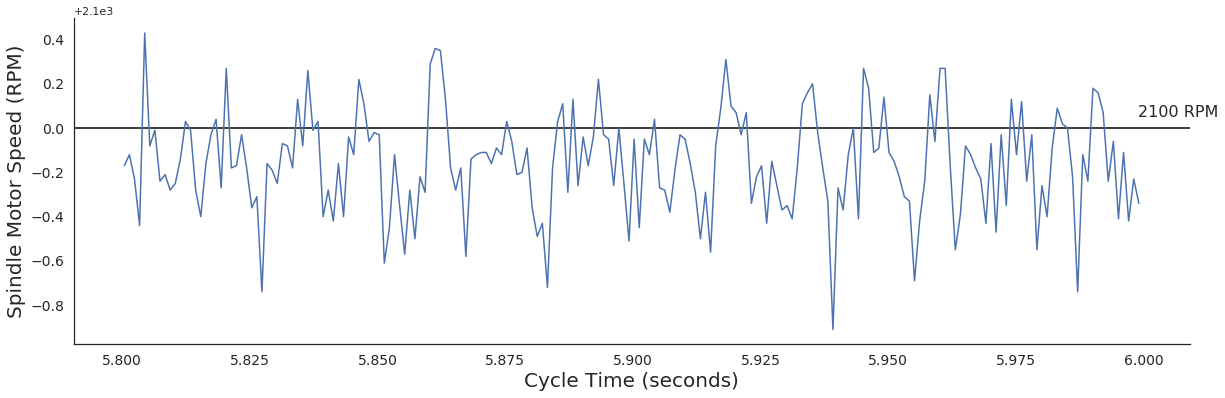
While the mill is doing an extremely good job of keeping the spindle speed fixed during these time periods, it is not perfect. The speed wobbles around its programmed value of 2100 RPM by a fraction of an RPM. Already at a cursory glance, this “noise” in the spindle speed signal appears to contain some structure. For example, the largest wiggles here have a periodicity of ~14 milliseconds.
High-quality spindles actually maintain consistent RPMs via an electronic feedback mechanism, which is crucial given the irregular torques experienced during machining. The fluctuations produced by the spindle while it fights to stay at its programmed speed can therefore also serve as a reflection of the forces exerted by cutting metal. By closely studying these fluctuations, we can obtain clues about the moment-to-moment interactions between the tool face and the material. Because spindle speed can be monitored extremely robustly at high frequency, this provides us with a unique probe of machining conditions.
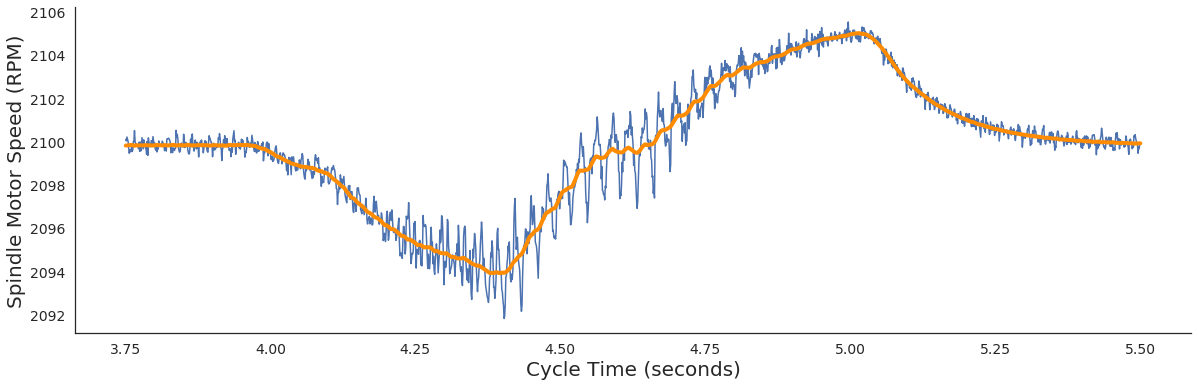
To separate out the short-timescale feedback effects from the overall spindle speed trends commanded by the control, we first perform a mathematical smoothing operation that tends to average-away the fluctuations. Let’s see what this looks like on a slightly more complicated in-cut spindle speed signal, where the overall trend is not quite constant. The original signal is in blue, while our smoothed fit is in orange.
We then take the differences between the original signal and this smoothed signal, and chain them together to get a new signal that is “pure noise.”
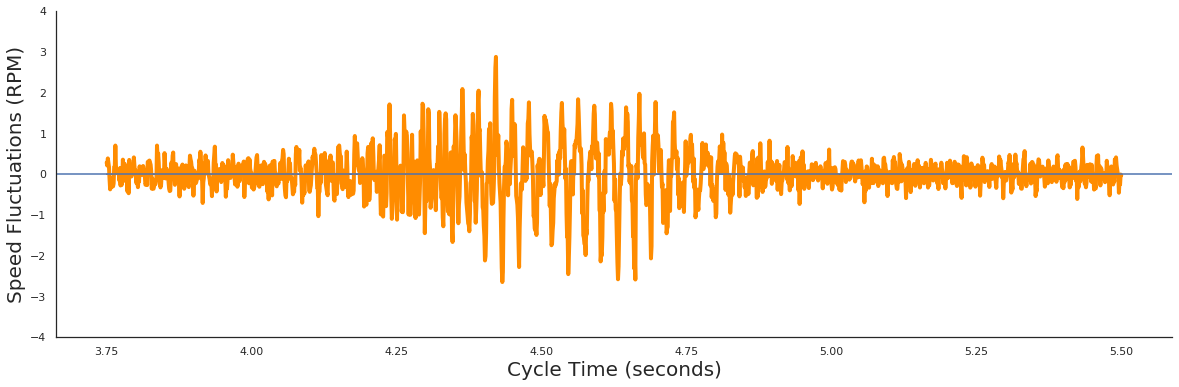
These plots start to resemble the kinds of patterns seen for sound when it is represented as a digital signal. And we can expect a similar density of information, but now representing, effectively, the sound produced by the spindle motor. In fact, the frequency range covered by this procedure spans from about 10 Hz to 500 Hz, which significantly overlaps with human hearing, from just below the lowest note on a grand piano up to about an octave above middle-C. In effect, we can put a virtual ear up to the spindle motor and listen to the tune that it is playing!
Keeping an Ear on Machining Quality
Parts that are being consistently produced cycle-to-cycle translate into a particular melody on the spindle motor. And just as we might easily pick up on any off-notes during the playing of a familiar tune, machining problems from worn-out or fractured tools can surface as patterns in the spindle speed fluctuations that sound unusual compared to in-spec machining.
The particular mill used for previous examples has a history of experiencing instabilities while drilling due to tool wear. This has often required scrapping or reworking of parts — once the operator has caught on to the problem. In just one example, sixteen consecutive parts had to be tossed away, at a cost of hundreds of dollars of lost revenue.
This event was being monitored by MachineMetrics’s high-frequency data collection during its R&D phase. The mill makes six holes in sequence as part of its program, and we collected some sound snippets during the machining period of both normal and scrapped parts.
Can you hear the difference?
Viewed as a sound pattern derived from the spindle speed, this is what these cuts look like for the first bad cycle and the ones immediately before and after.
Can you see the difference?
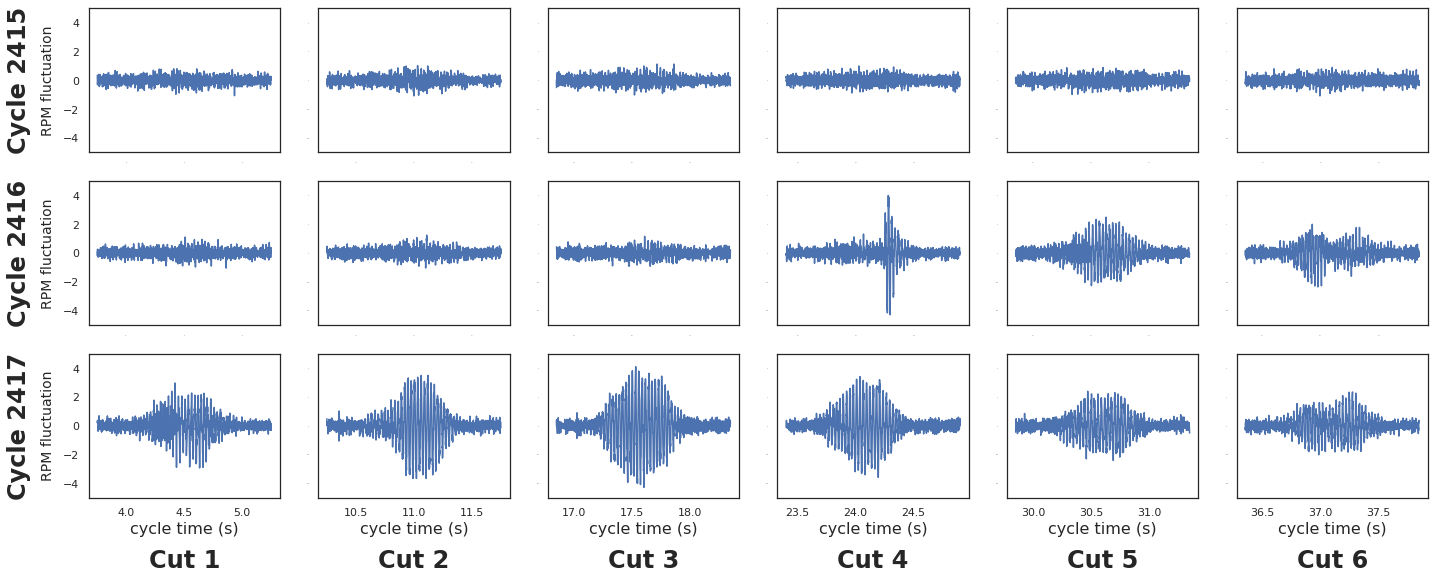
Looking back at what happened from that perspective, we can spot the exact moment that the problematic instabilities developed, a full twenty minutes before quality-assurance caught the issue.
Automated Failure Detection
Developing algorithms for automated and generalized detection of such events is now a major project underway at MachineMetrics. By representing the data in this manner, we open up many possibilities for employing the rich set of analysis tools from the field of digital signal processing and pattern recognition in sound recordings. But we have already made significant headway using some simple tricks for measuring how “noisy” a given pattern is.
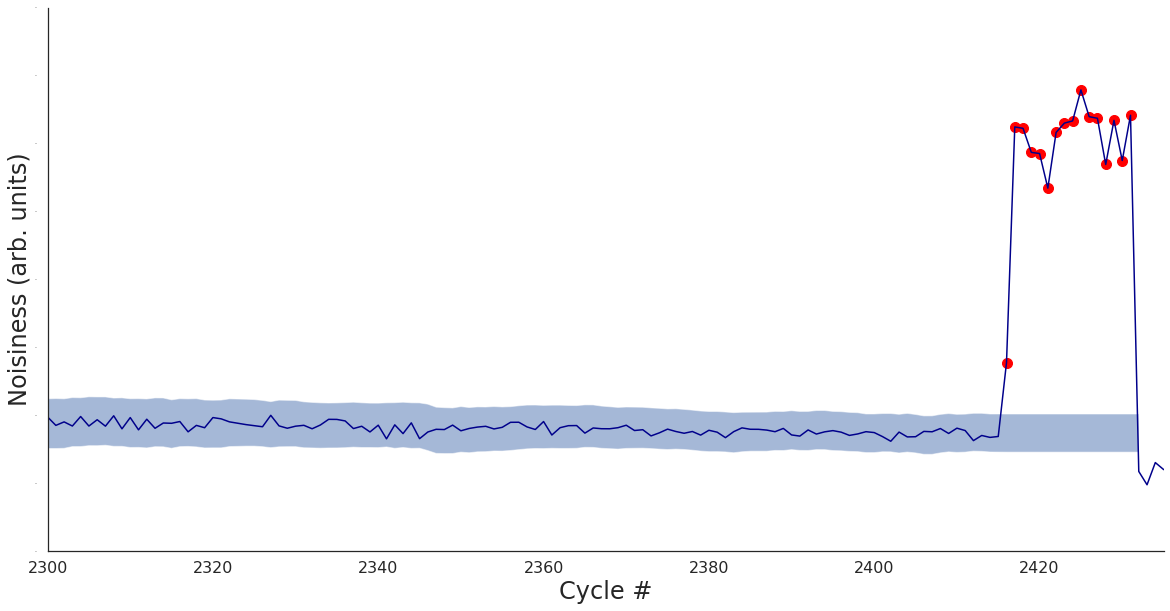
By monitoring the noise level of the spindle over the course of normal machining, it is possible to automatically learn its general trends and typical operating ranges. Large departures can then be immediately flagged as problematic. Applying such a procedure, we find hours of otherwise normal part cycles leading up to the corruption event, followed by a string of obvious outlier cycles and eventual replacement of the tool by the operator.
Further diagnostic insight can be obtained by studying these sound patterns according to the prevalence of various tones or frequencies. This is accomplished through another common mathematical operation, the Fourier transform. For each individual cycle, we can plot the loudness of different frequencies, and then inspect this plot for clues. If we imagine stacking a bunch of those plots on top of each other and making a flipbook out of them, we can make a little movie of how the loudness of different frequencies is changing from cycle-to-cycle.
The obvious pattern here is a spike of signal that jumps up at the corruption event, and then disappears entirely after the tool is replaced. This tells us that the extra noise is mostly coming in at a frequency of 35 Hz. Not coincidentally, this is the same frequency that the spindle is turning at: 35 Hz translates to 2100 RPM. The spindle, experiencing increasingly erratic torques due to a compromised tool, is fed an extra pulse of compensating power at each turn in order to keep its speed stable. Keeping track of frequency spikes in spindle speed and other metrics could soon become a standard feature of our automated machining quality monitoring — literally keeping an ear out for unusual-sounding notes.
Implications for Industry
Prior to the mid-20th century, machine health monitoring almost purely relied on the ear of the machine operator. A good machinist not only had great dexterity and uncanny nimbleness of hand, but also a discerning ear for the nuances of the machine and great skill in learning the patterns of the system he tended to.
After the advent of MEMS and sensor technology in the 1960s, this system was supplemented and in some cases partially replaced by automated methods. Accelerometers, microphones, and piezoelectric sensors helped detect slight deviations from normal activity and assisted machinists in diagnosing problems more reliably. However, mass-adoption never took hold due to the invasiveness of the installations and difficulty scaling across enterprises. This status quo has been the state of the industry for the past six decades or so.
We at MachineMetrics are interested in ushering in a new age of predictive machining, one in which our techniques for the prognostics and health management of machines have an affinity for mass-deployment. Our goal is to approach a truly democratized, plug-and-play solution. This shift has been long overdue.
We believe the technology now exists to make this commercially viable, though the execution and implementation remain critical to achieving this vision. By demonstrating that we essentially have “ears” on thousands of machines without ever setting foot on the factory floor, we are confident our findings have potentially great consequences and contribute substantially to this goal. Without any sort of sensor installations, we can remotely monitor the sound of the machine and infer the health of it, much like operators do.
What’s more, it’s not just our team that can do this — any data science team with access to the MachineMetrics platform can too, allowing for a truly distributed research and discovery process. (We aren’t the only ones finding innovative uses for our data — every day, our customers surprise us with their insights and creativity.)
 How you'll feel if you listen to the entire 8-track.
Ready to empower your shop floor?
Learn More

.png?width=1960&height=1300&name=01_comp_Downtime-%26-Quality_laptop%20(1).png)


Comments