
Book a Demo of MachineMetrics
The leading platform to collect, monitor, analyze, and drive action with machine data. Set up time with a product specialist to learn how we can help your operation.
Ready to empower your shop floor?
Learn More.svg)

Knowing why machines are not running is key to understanding machine utilization problems. The machine data tells us that the machine is down and any faults that might have led to it, but the operators are the only ones that know the full context of the machine downtime. At MachineMetrics, we've created the best solution to gathering this information. Having a touchscreen at each machine with an intuitive interface that asks the operator to categorize downtime as it's happening allows this information to be made available in real-time to managers in downtime pareto charts. For some events such as tool changeovers or part changeovers, these downtimes can be categorized automatically from machine data by the MachineMetrics rules engine.
Let's dive a little deeper to learn how MachineMetrics helps you both understand and reduce your downtime.
Categorizing Downtime with MachineMetrics
As you probably already know, Downtime is any period of time when a workcenter is not in production (quite literally, down). Downtime can be categorized to help identify patterns in machine performance. With MachineMetrics, when a workcenter goes down, downtime is automatically logged as uncategorized for the period of time it is down. Using the MachineMetrics Operator View (which we discussed last week), Downtime can be categorized either while the machine is down or after the downtime has been recorded.
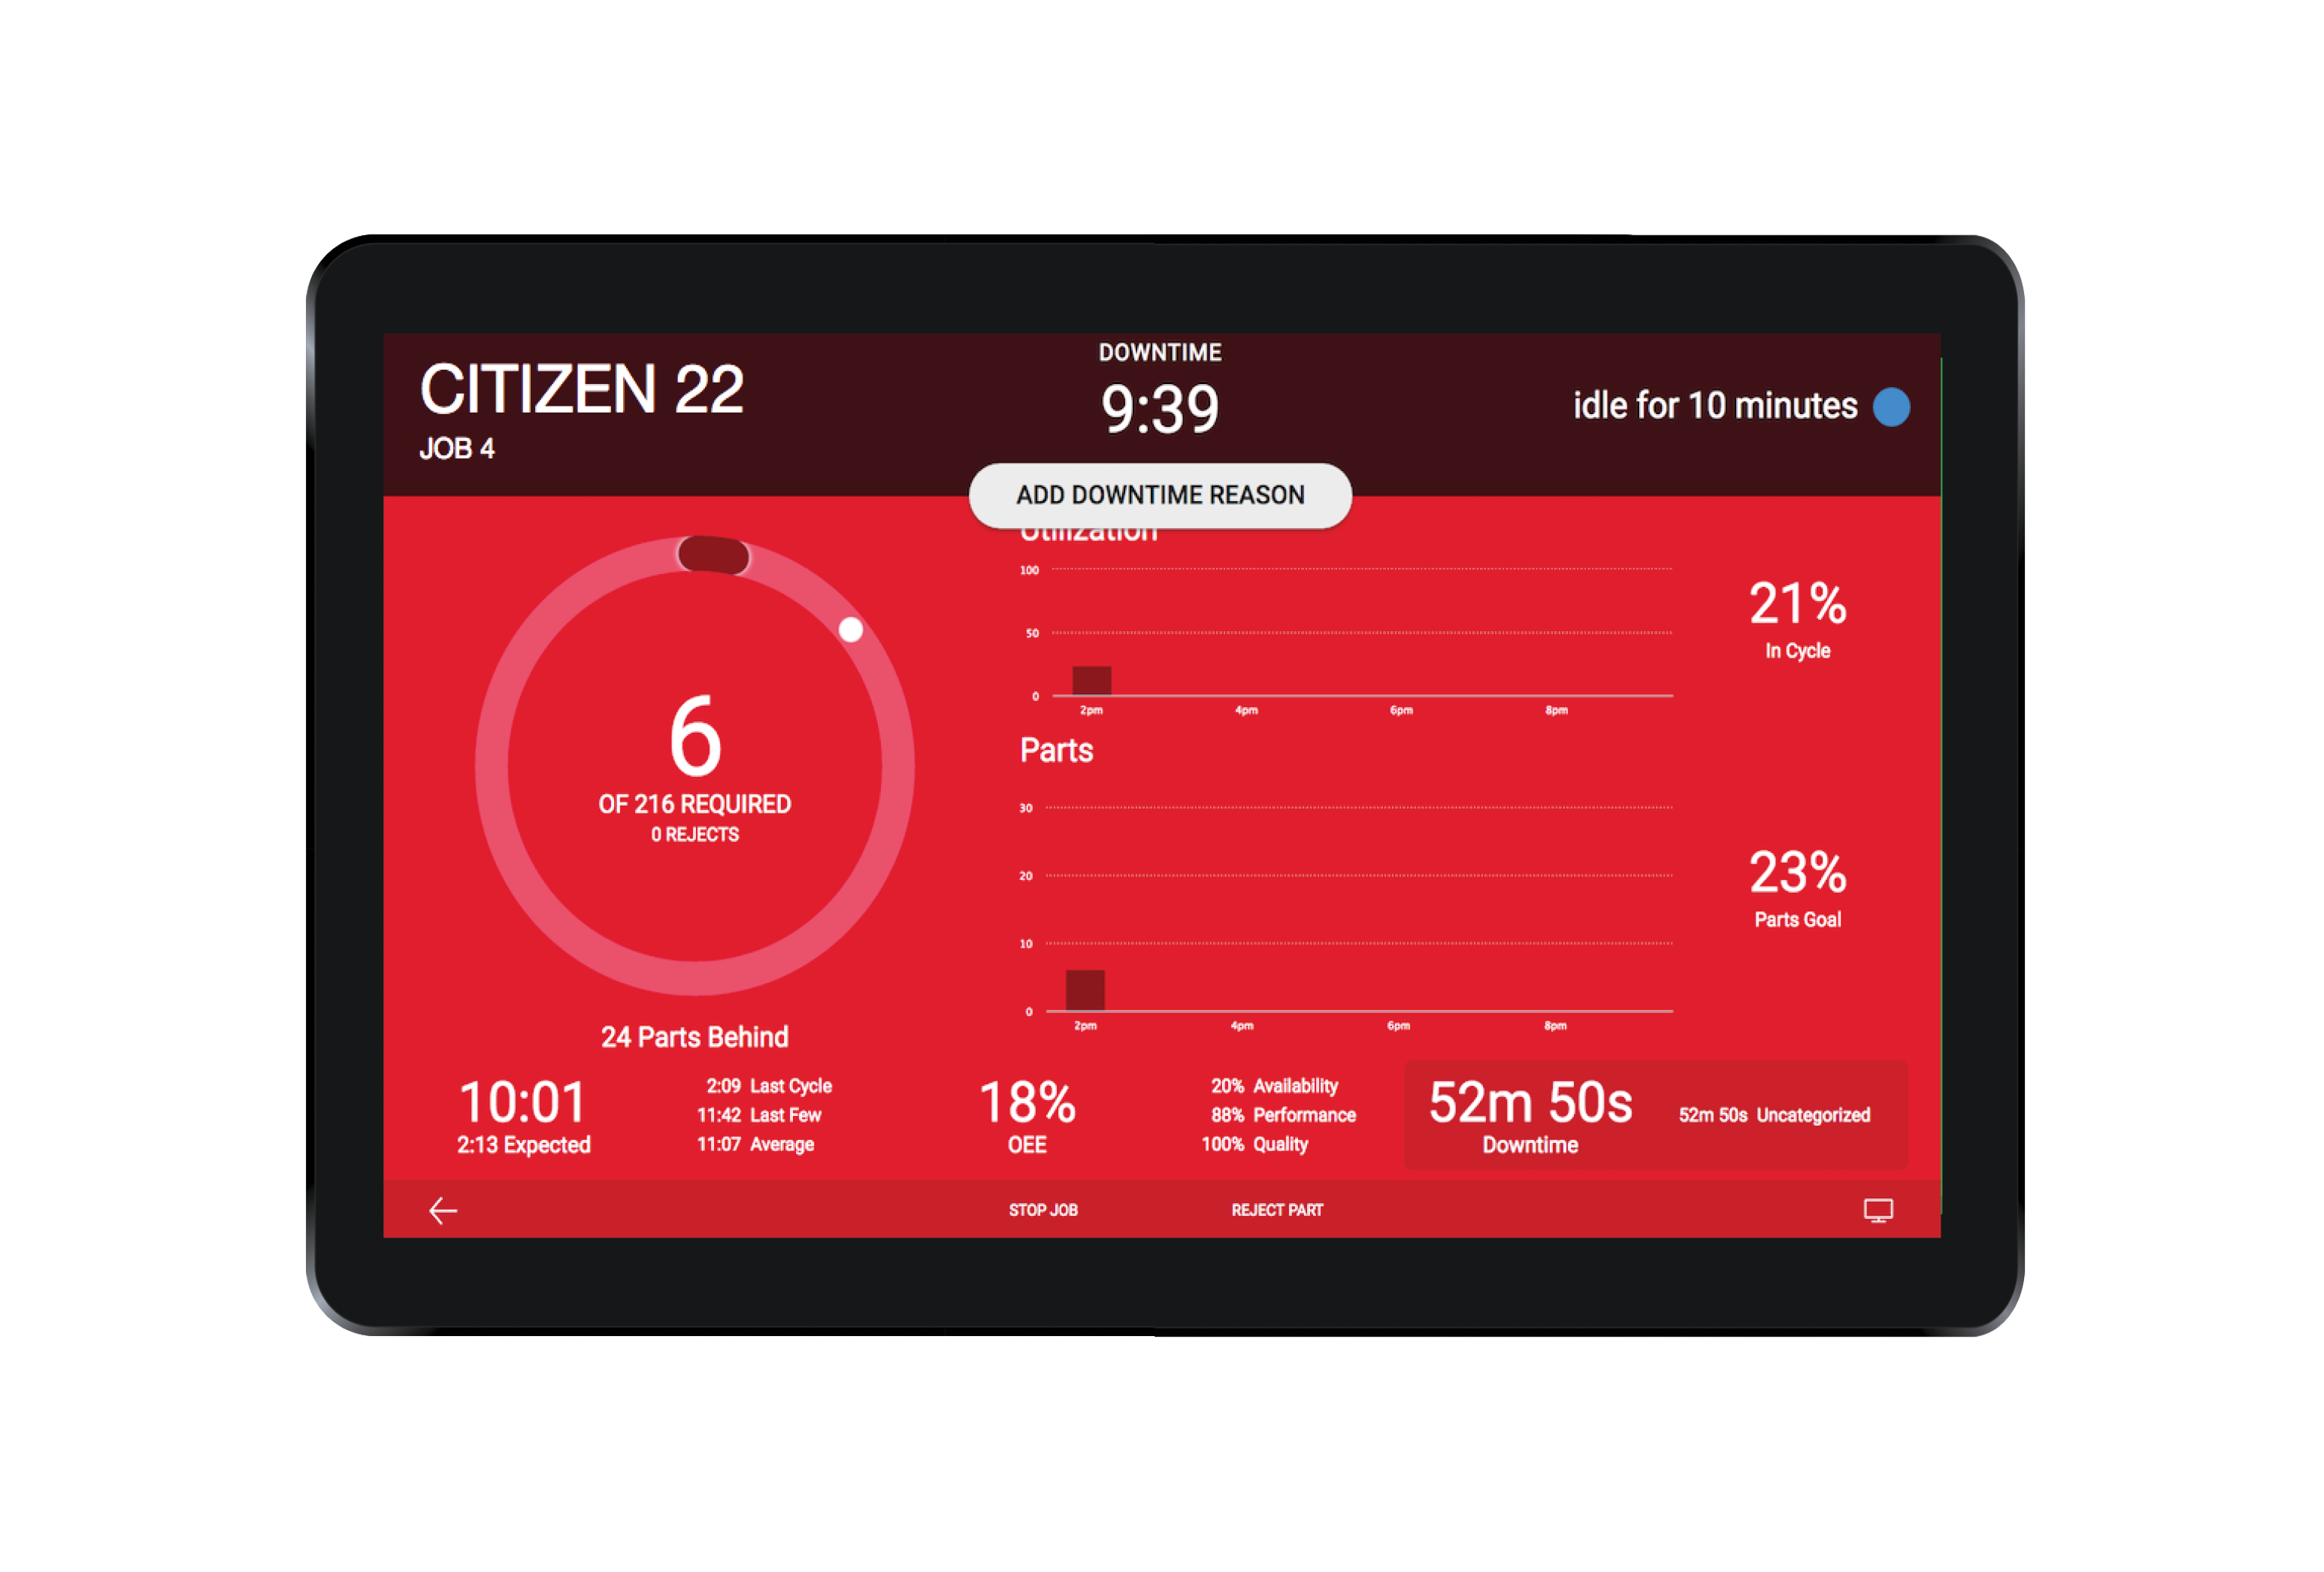
First, here's how to categorize a machine's current downtime:
In the Operator View, if a machine is down, a bar appears at the top of the screen indicating the machine is idle. The operator can then categorize this downtime by selecting the "Add Downtime Reason" button.
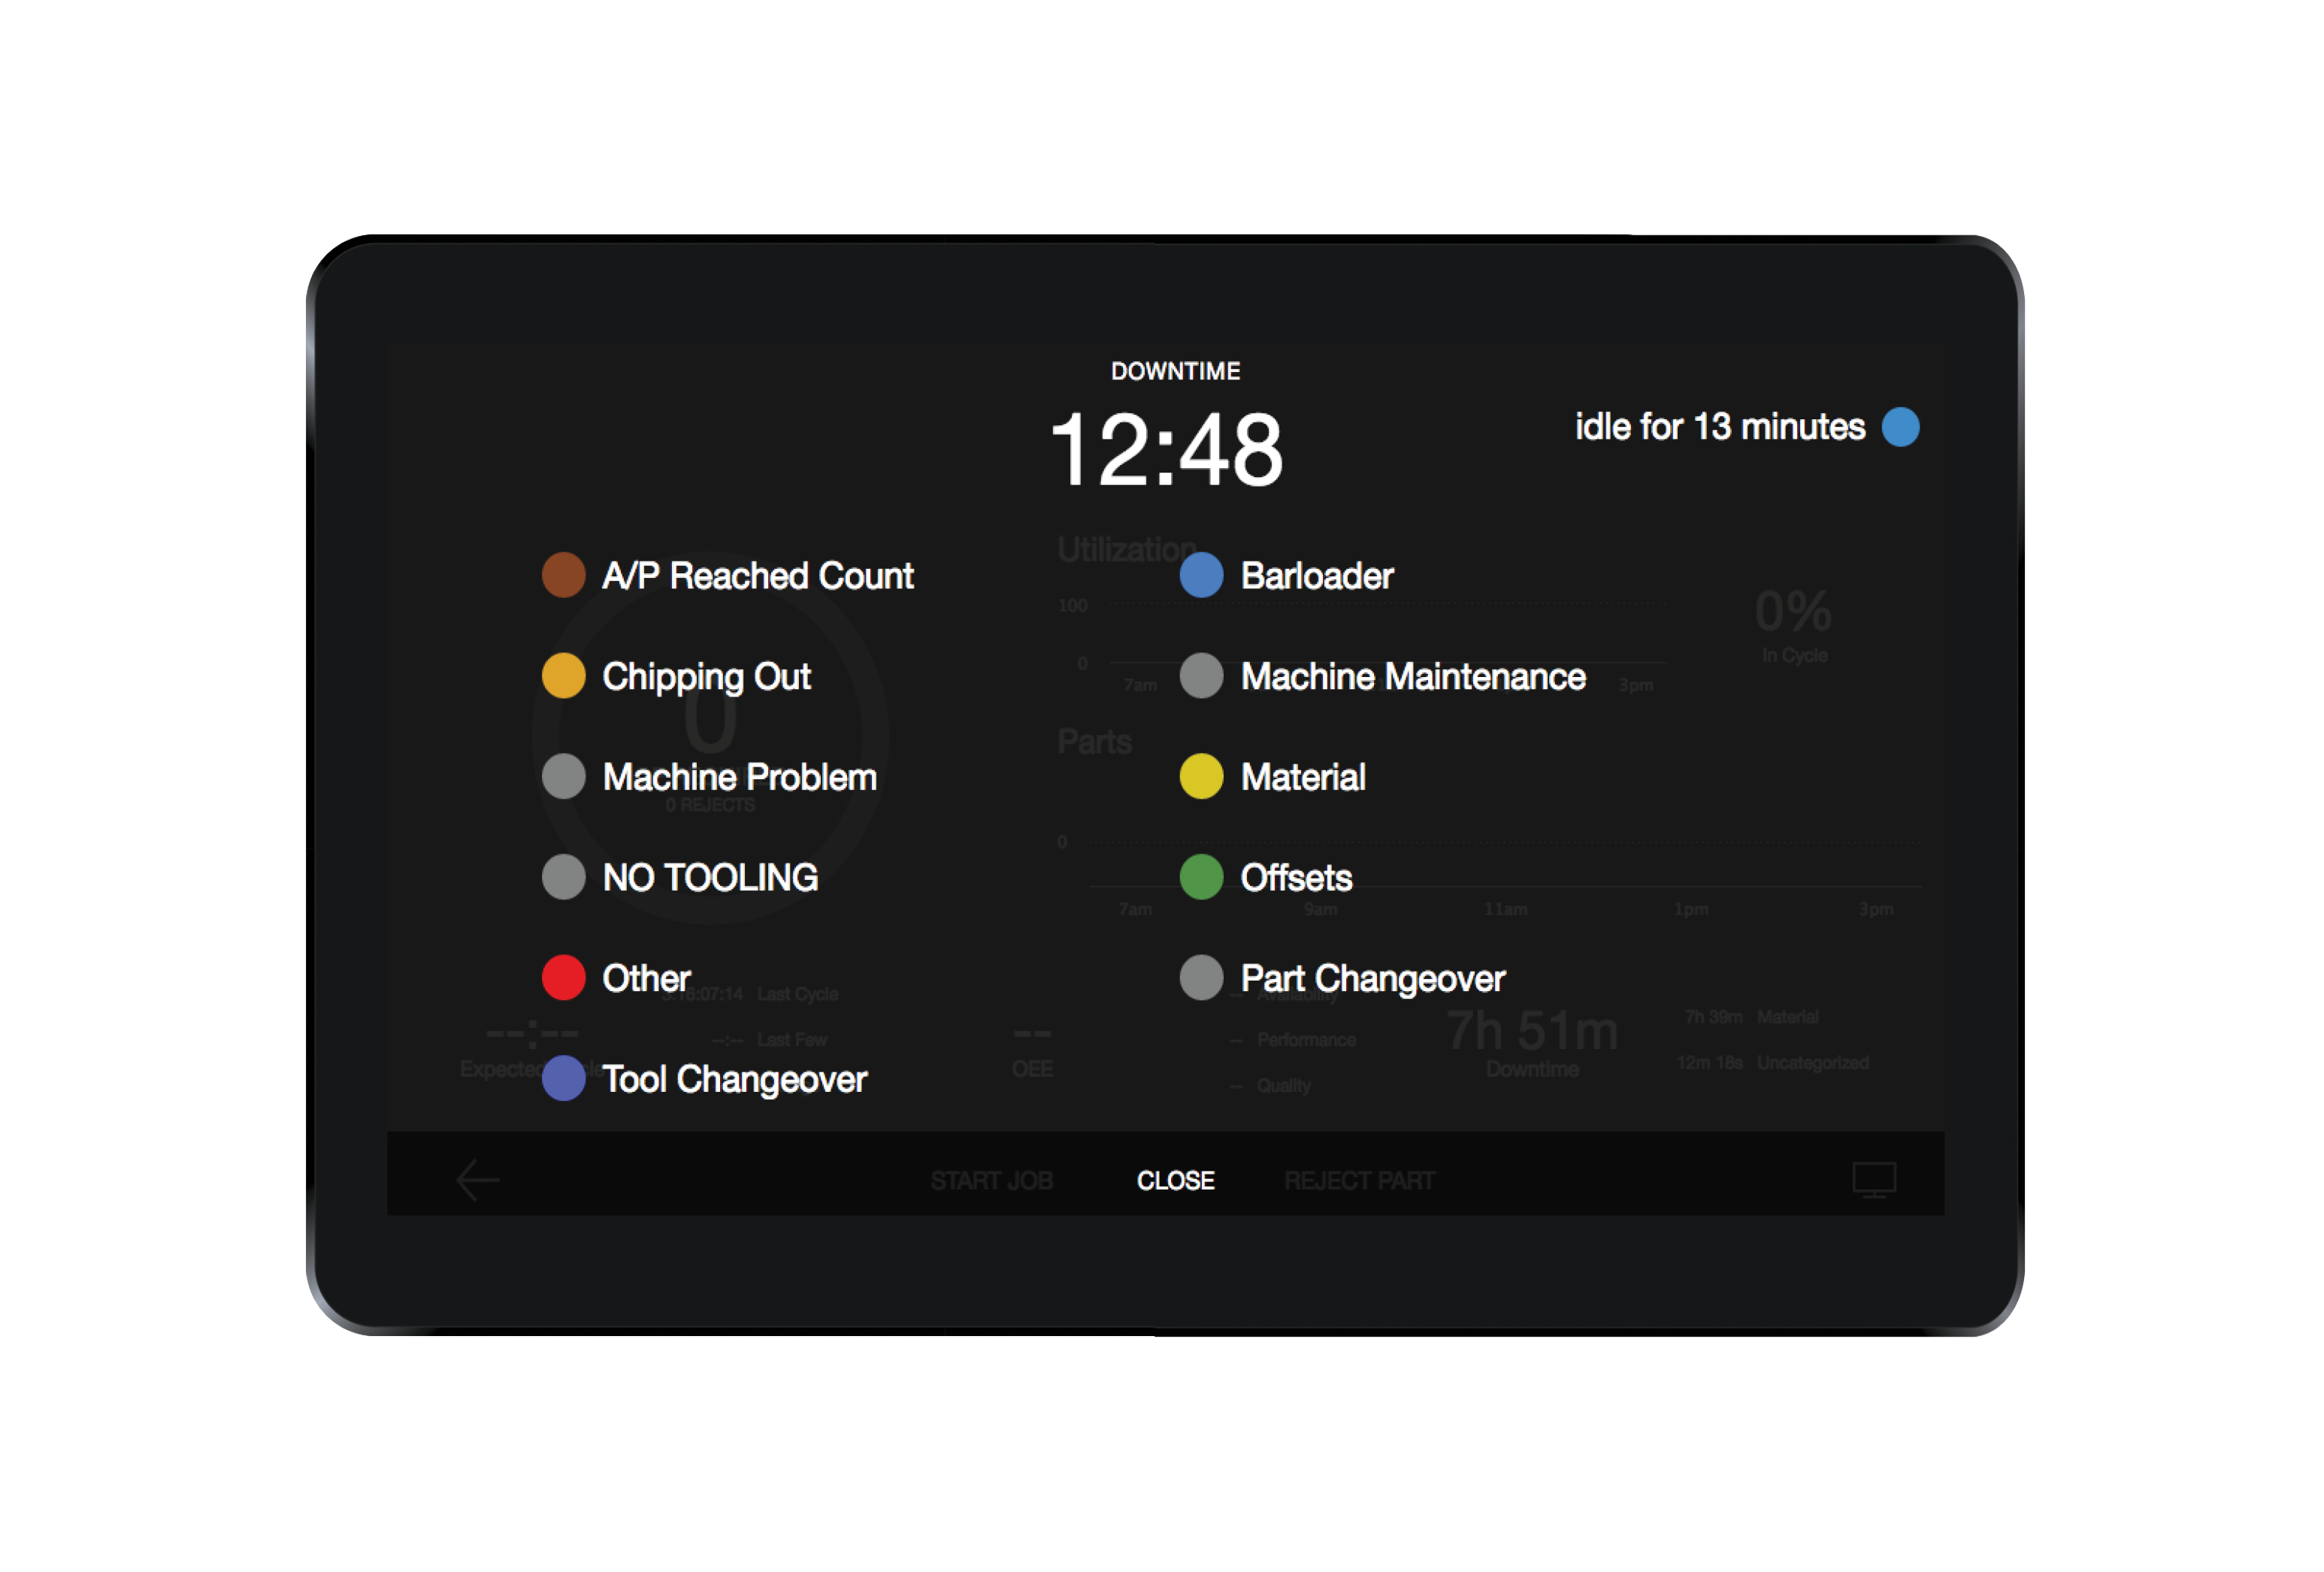
They will then be prompted to select a downtime category:
There are also two ways previously recorded downtime can be categorized:from the Operator View as well as from the Timeline page.
In order to categorize downtime from the Operator View, select the Downtime Box. The following screen will appear:
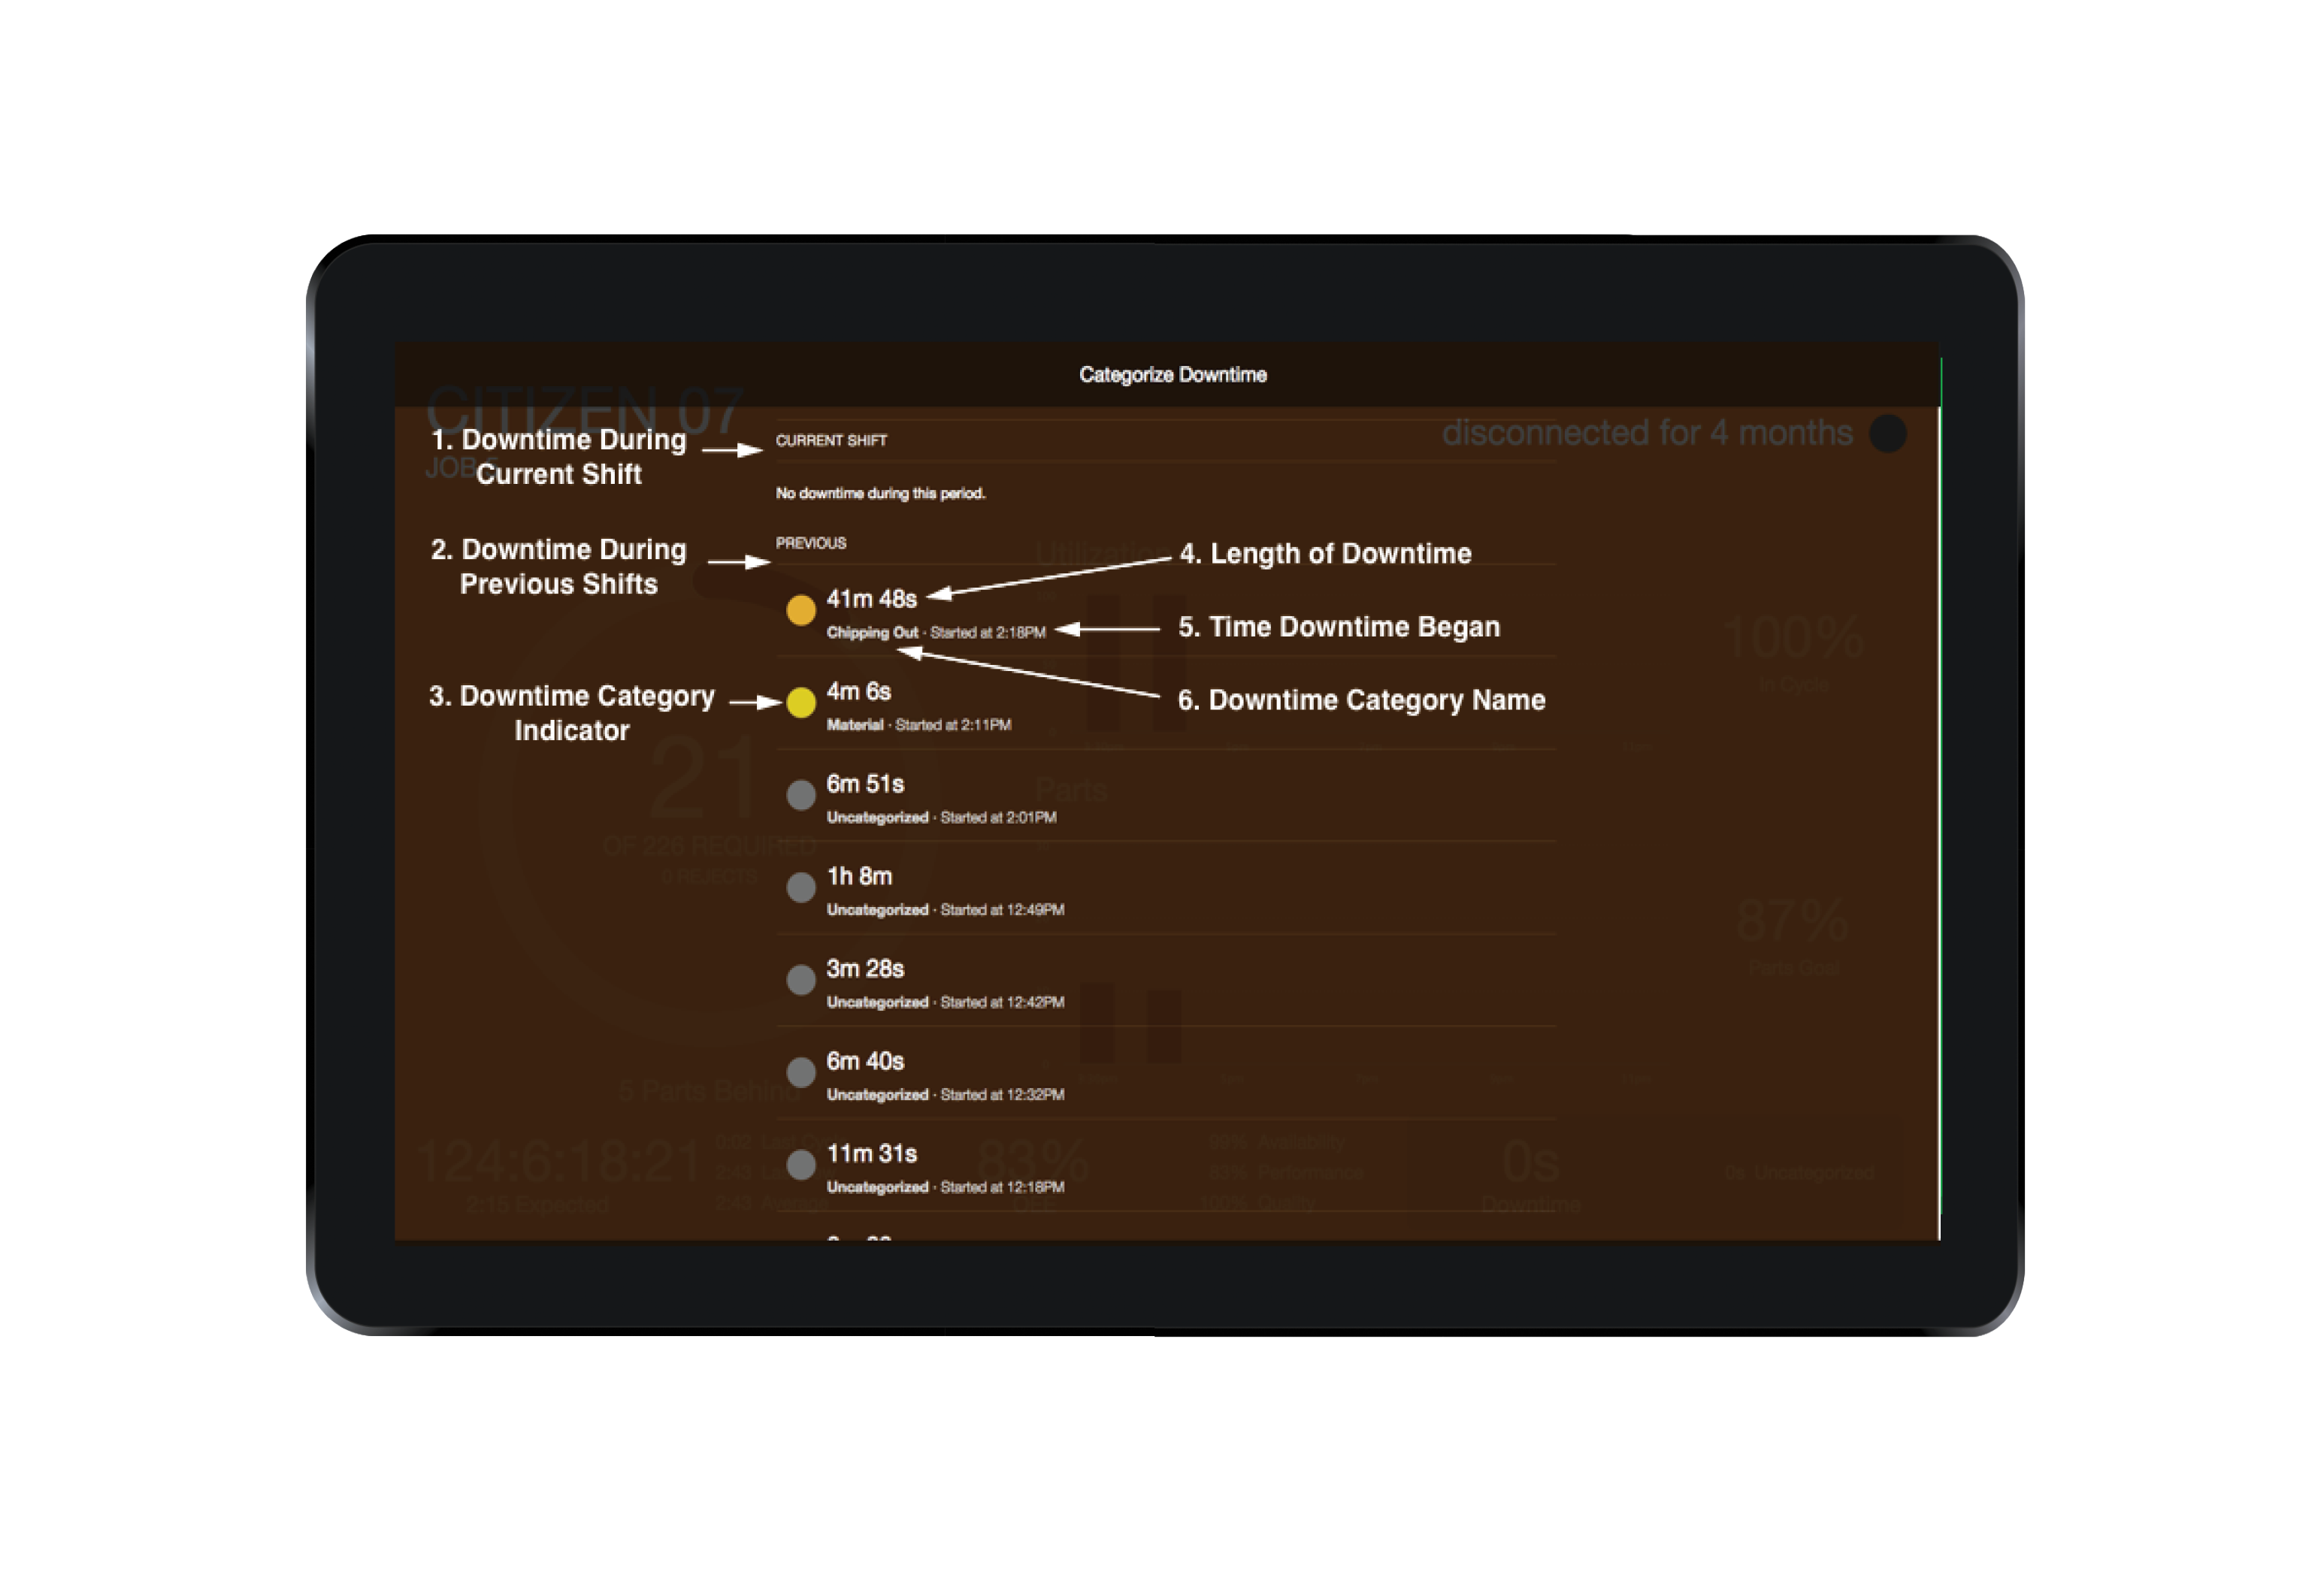 Downtime Screen:
The second way to categorize previously recorded downtime is using MachineMetrics' timeline view of a specific workcenter.
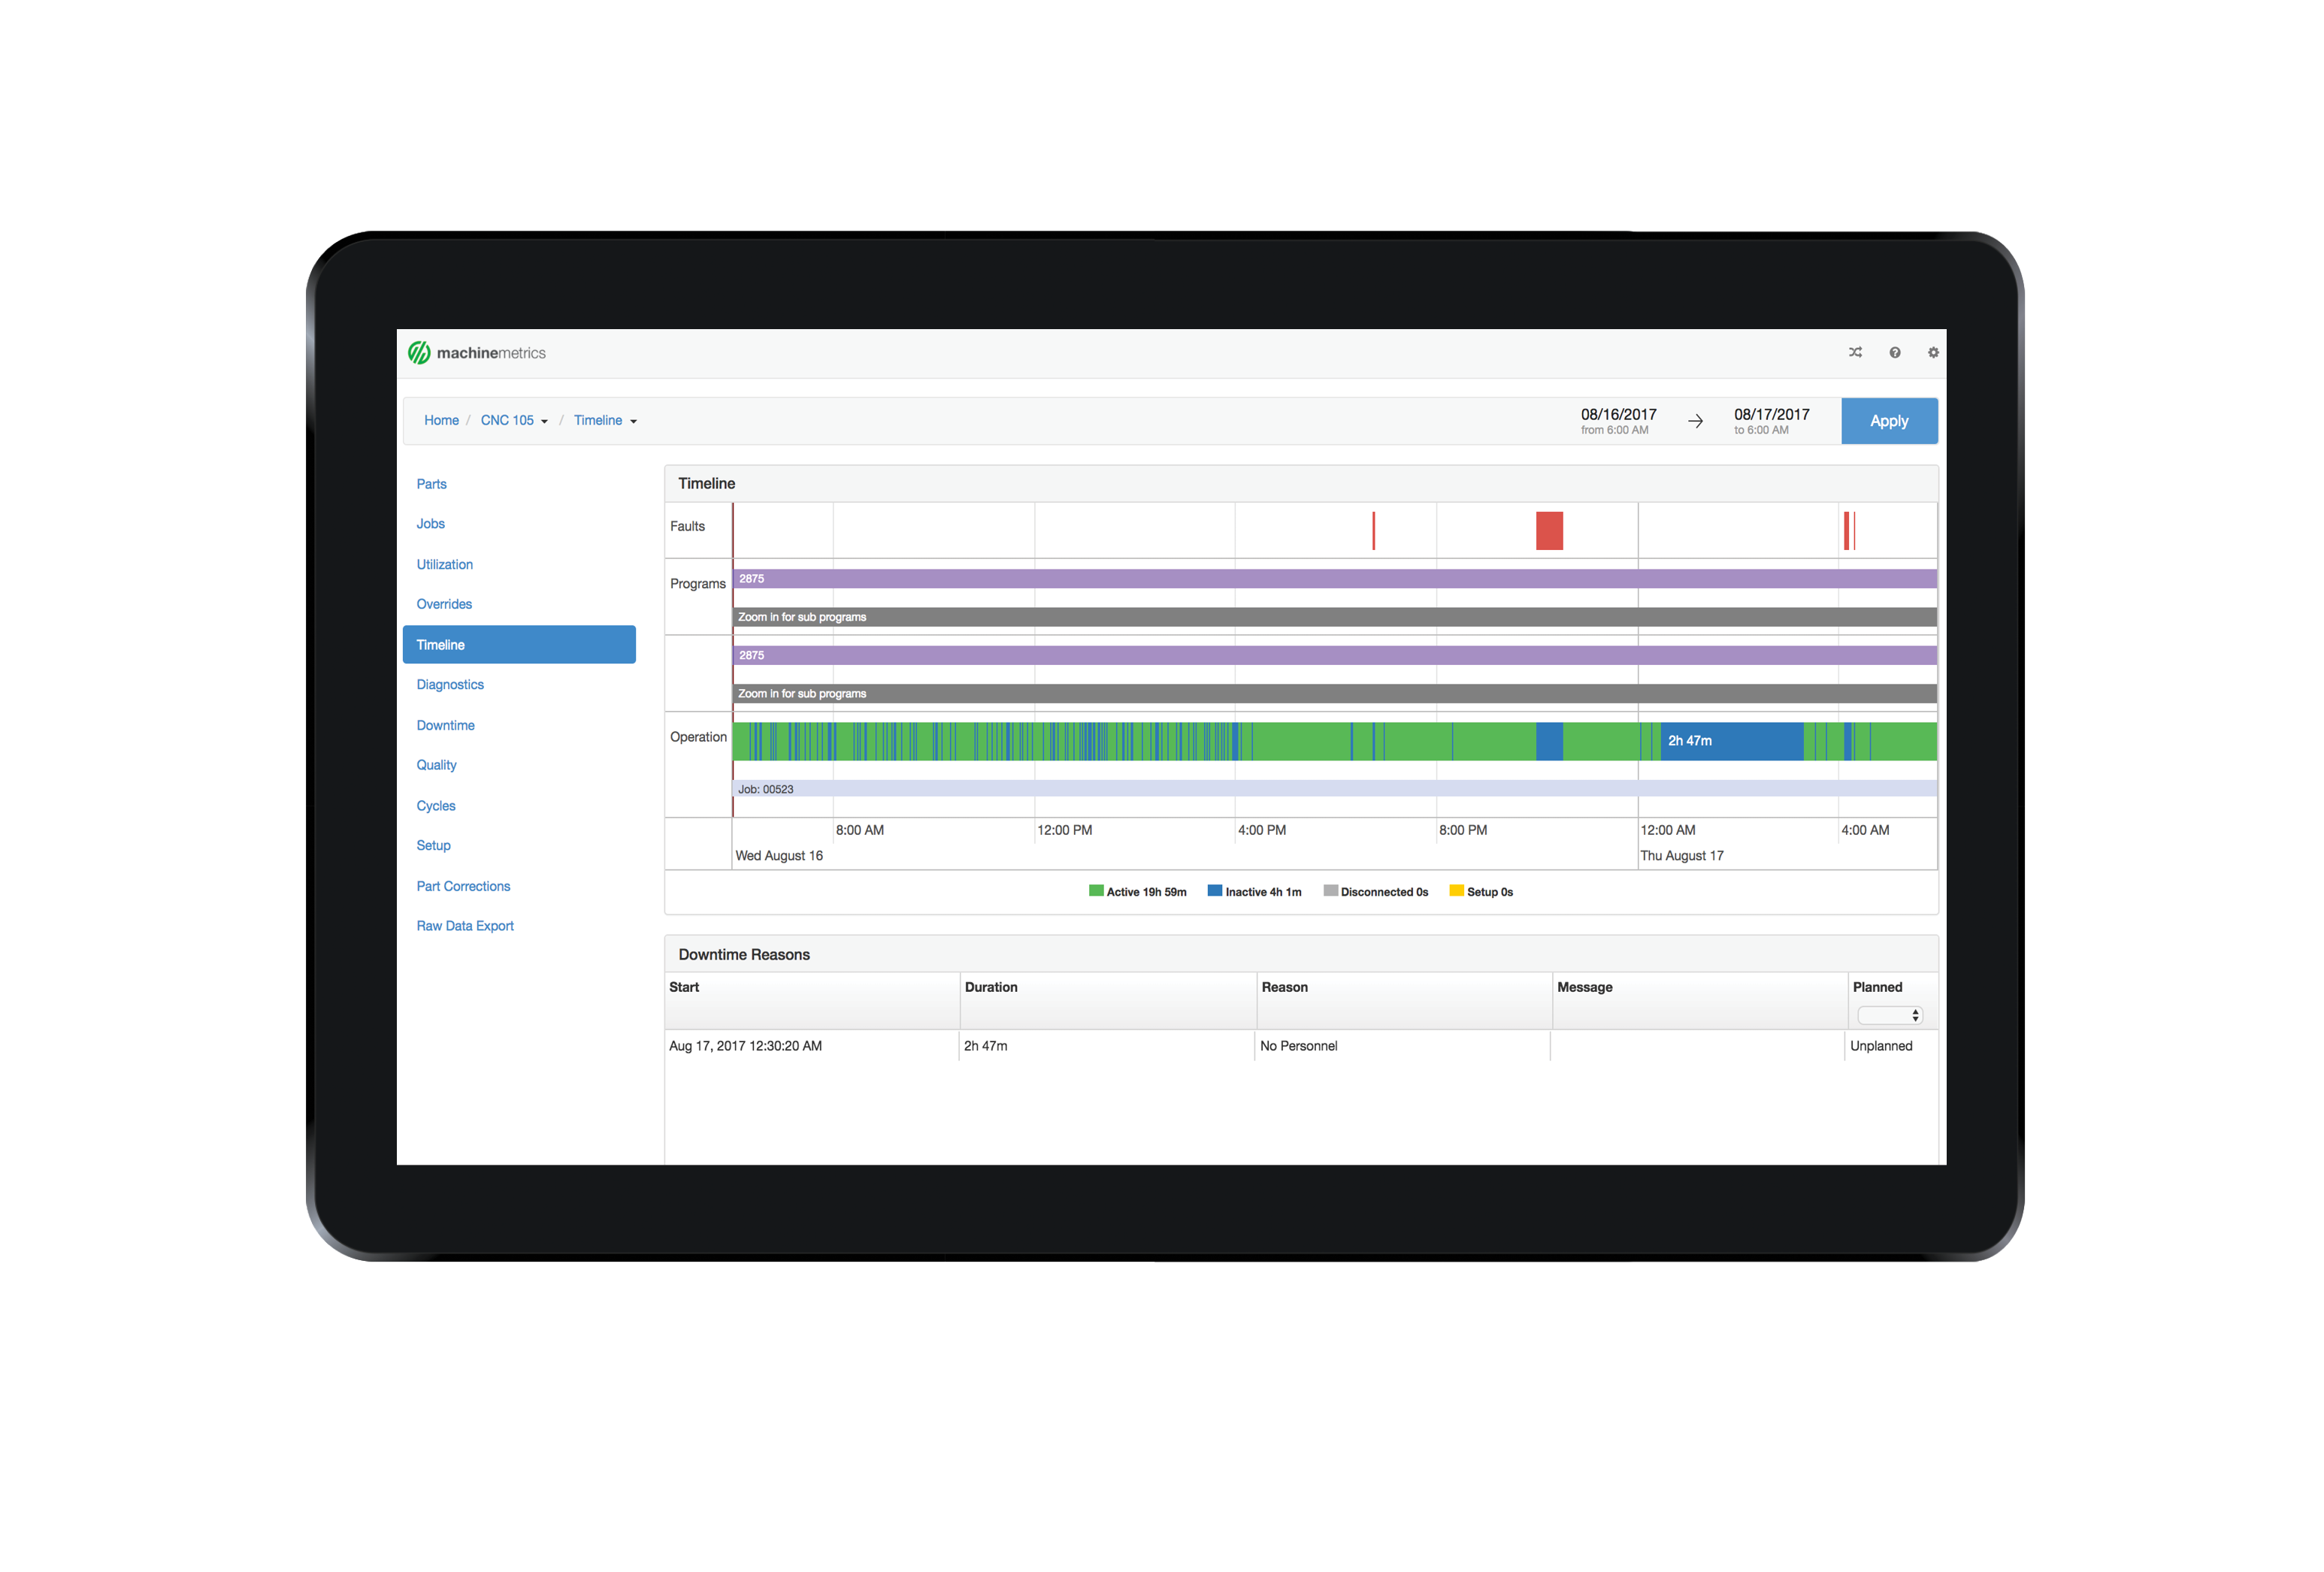 In the upper-right corner of the screen, you can select the date range that contains the downtime you want to categorize and hit "Apply".
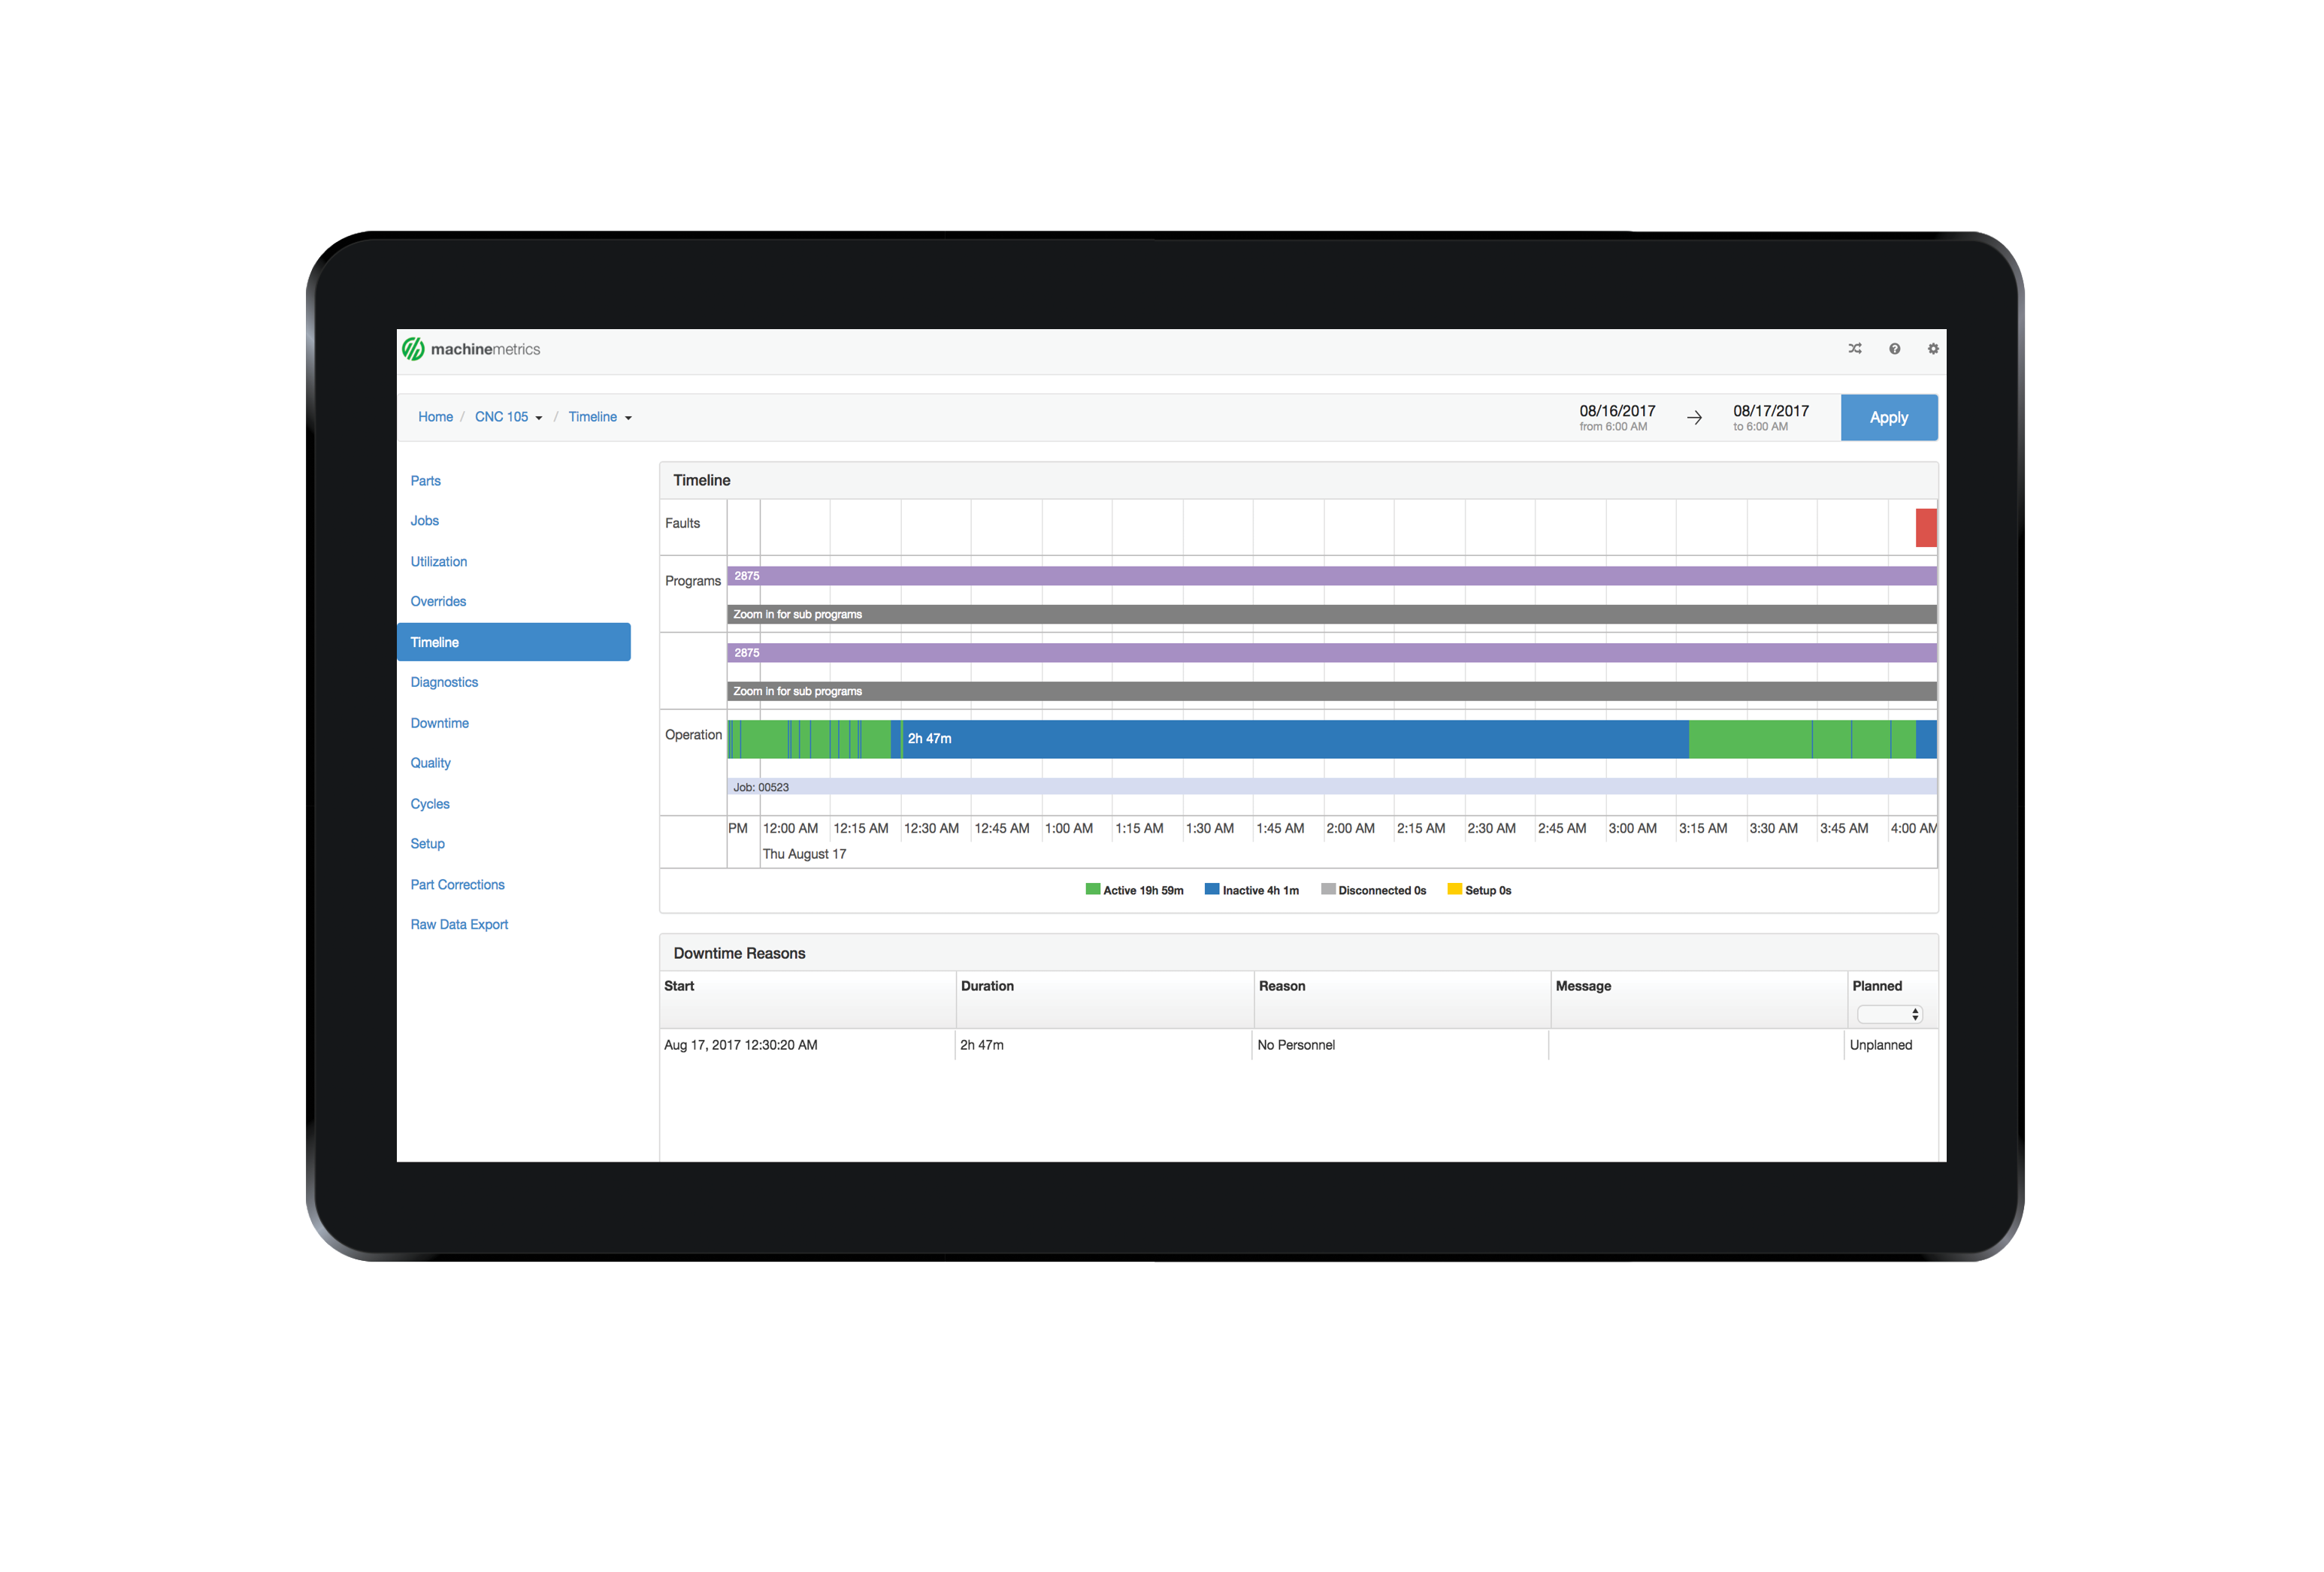 Next, you can select any portion of the timeline that represents downtime. A prompt will appear on the screen asking for information about this downtime. This downtime can then be categorized for a single reason or can be broken up into multiple reasons.
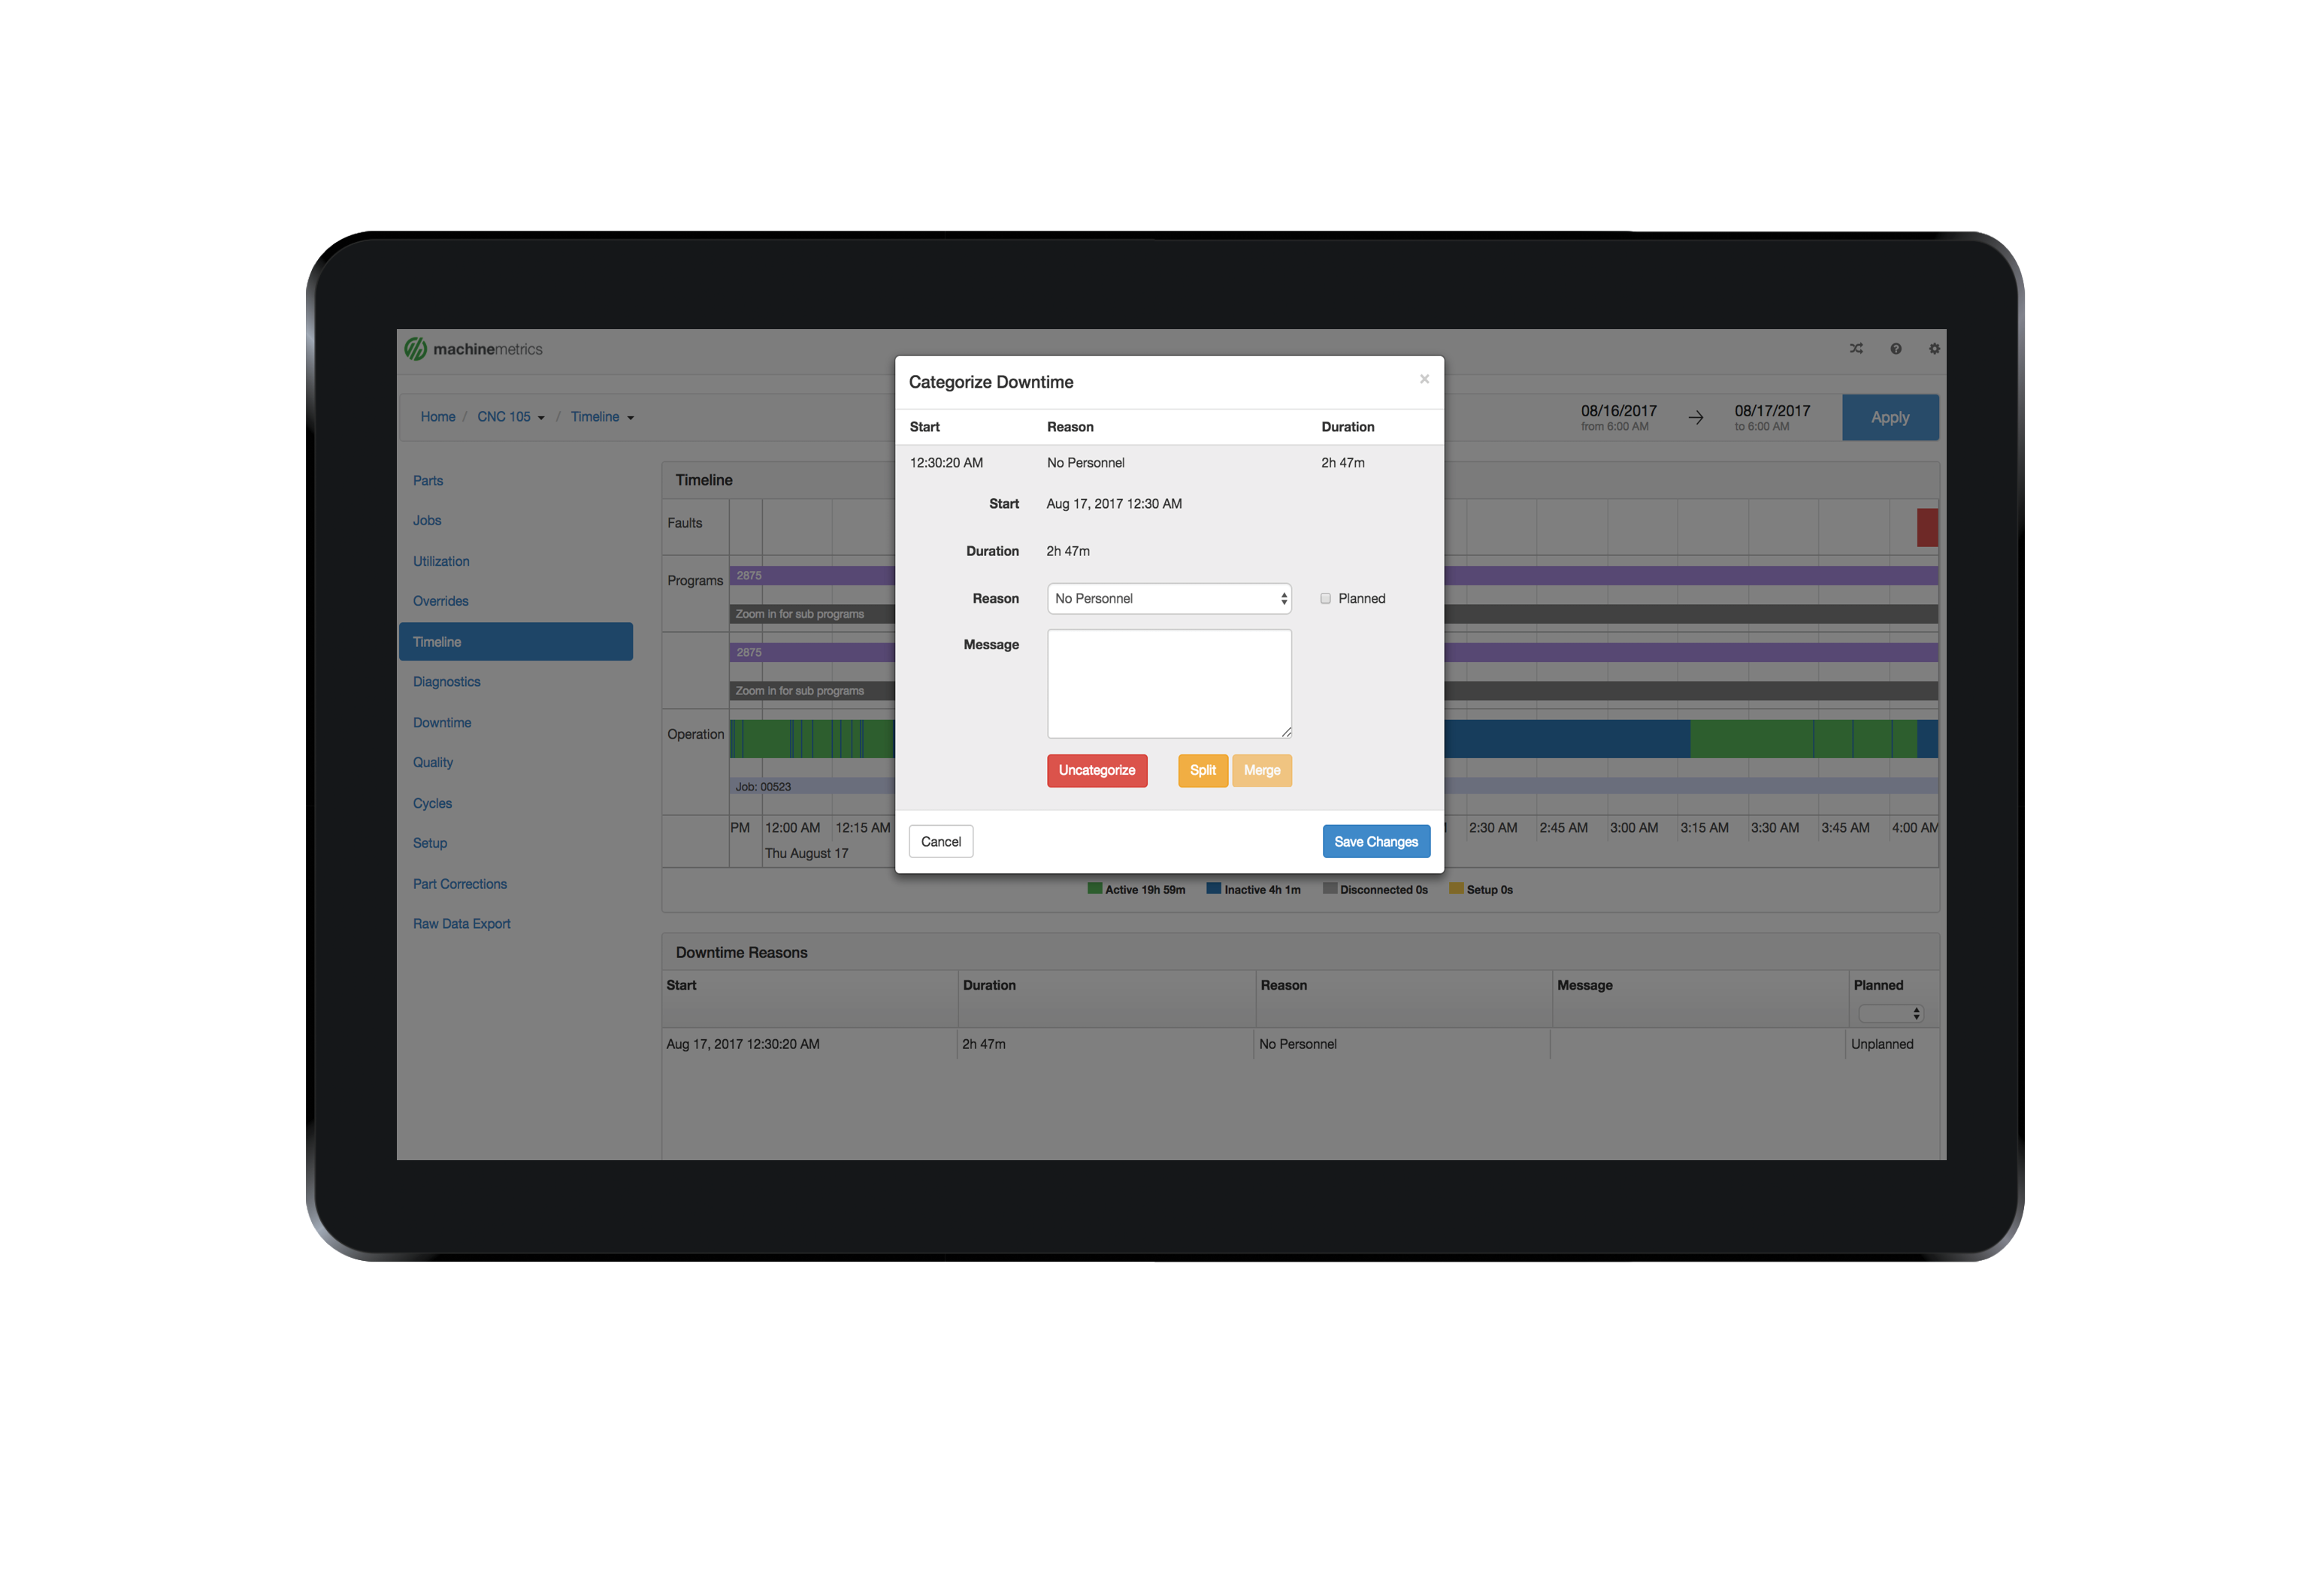
Verify that the Start Time and Duration are correct in order to ensure that the downtime you are categorizing is the correct one. You can then select a reason from the dropdown list and check the "Planned" checkbox if the downtime was planned. Adding a message to the downtime is optional, although highly recommended for additional context.
A downtime Pareto is difficult to produce. It requires understanding all downtime that occurs on a machine. Traditionally, obtaining the necessary data involves log sheets that require the operator to manually log all significant downtime. This manual approach will likely miss frequent downtime events that are only a few minutes each, but add up to a significant amount of time. Typically the actual data is logged well after the incident occurs, so the time is not very accurate. A machine monitoring system that tracks the cycle status of a machine in real-time is necessary to generate data for a downtime Pareto. It's also necessary for the operator to categorize each downtime event into reasonable buckets during or shortly after an event. Common categories of downtime include excessive tool changeover, excessive job changeover, lack of operator, and unplanned machine maintenance.
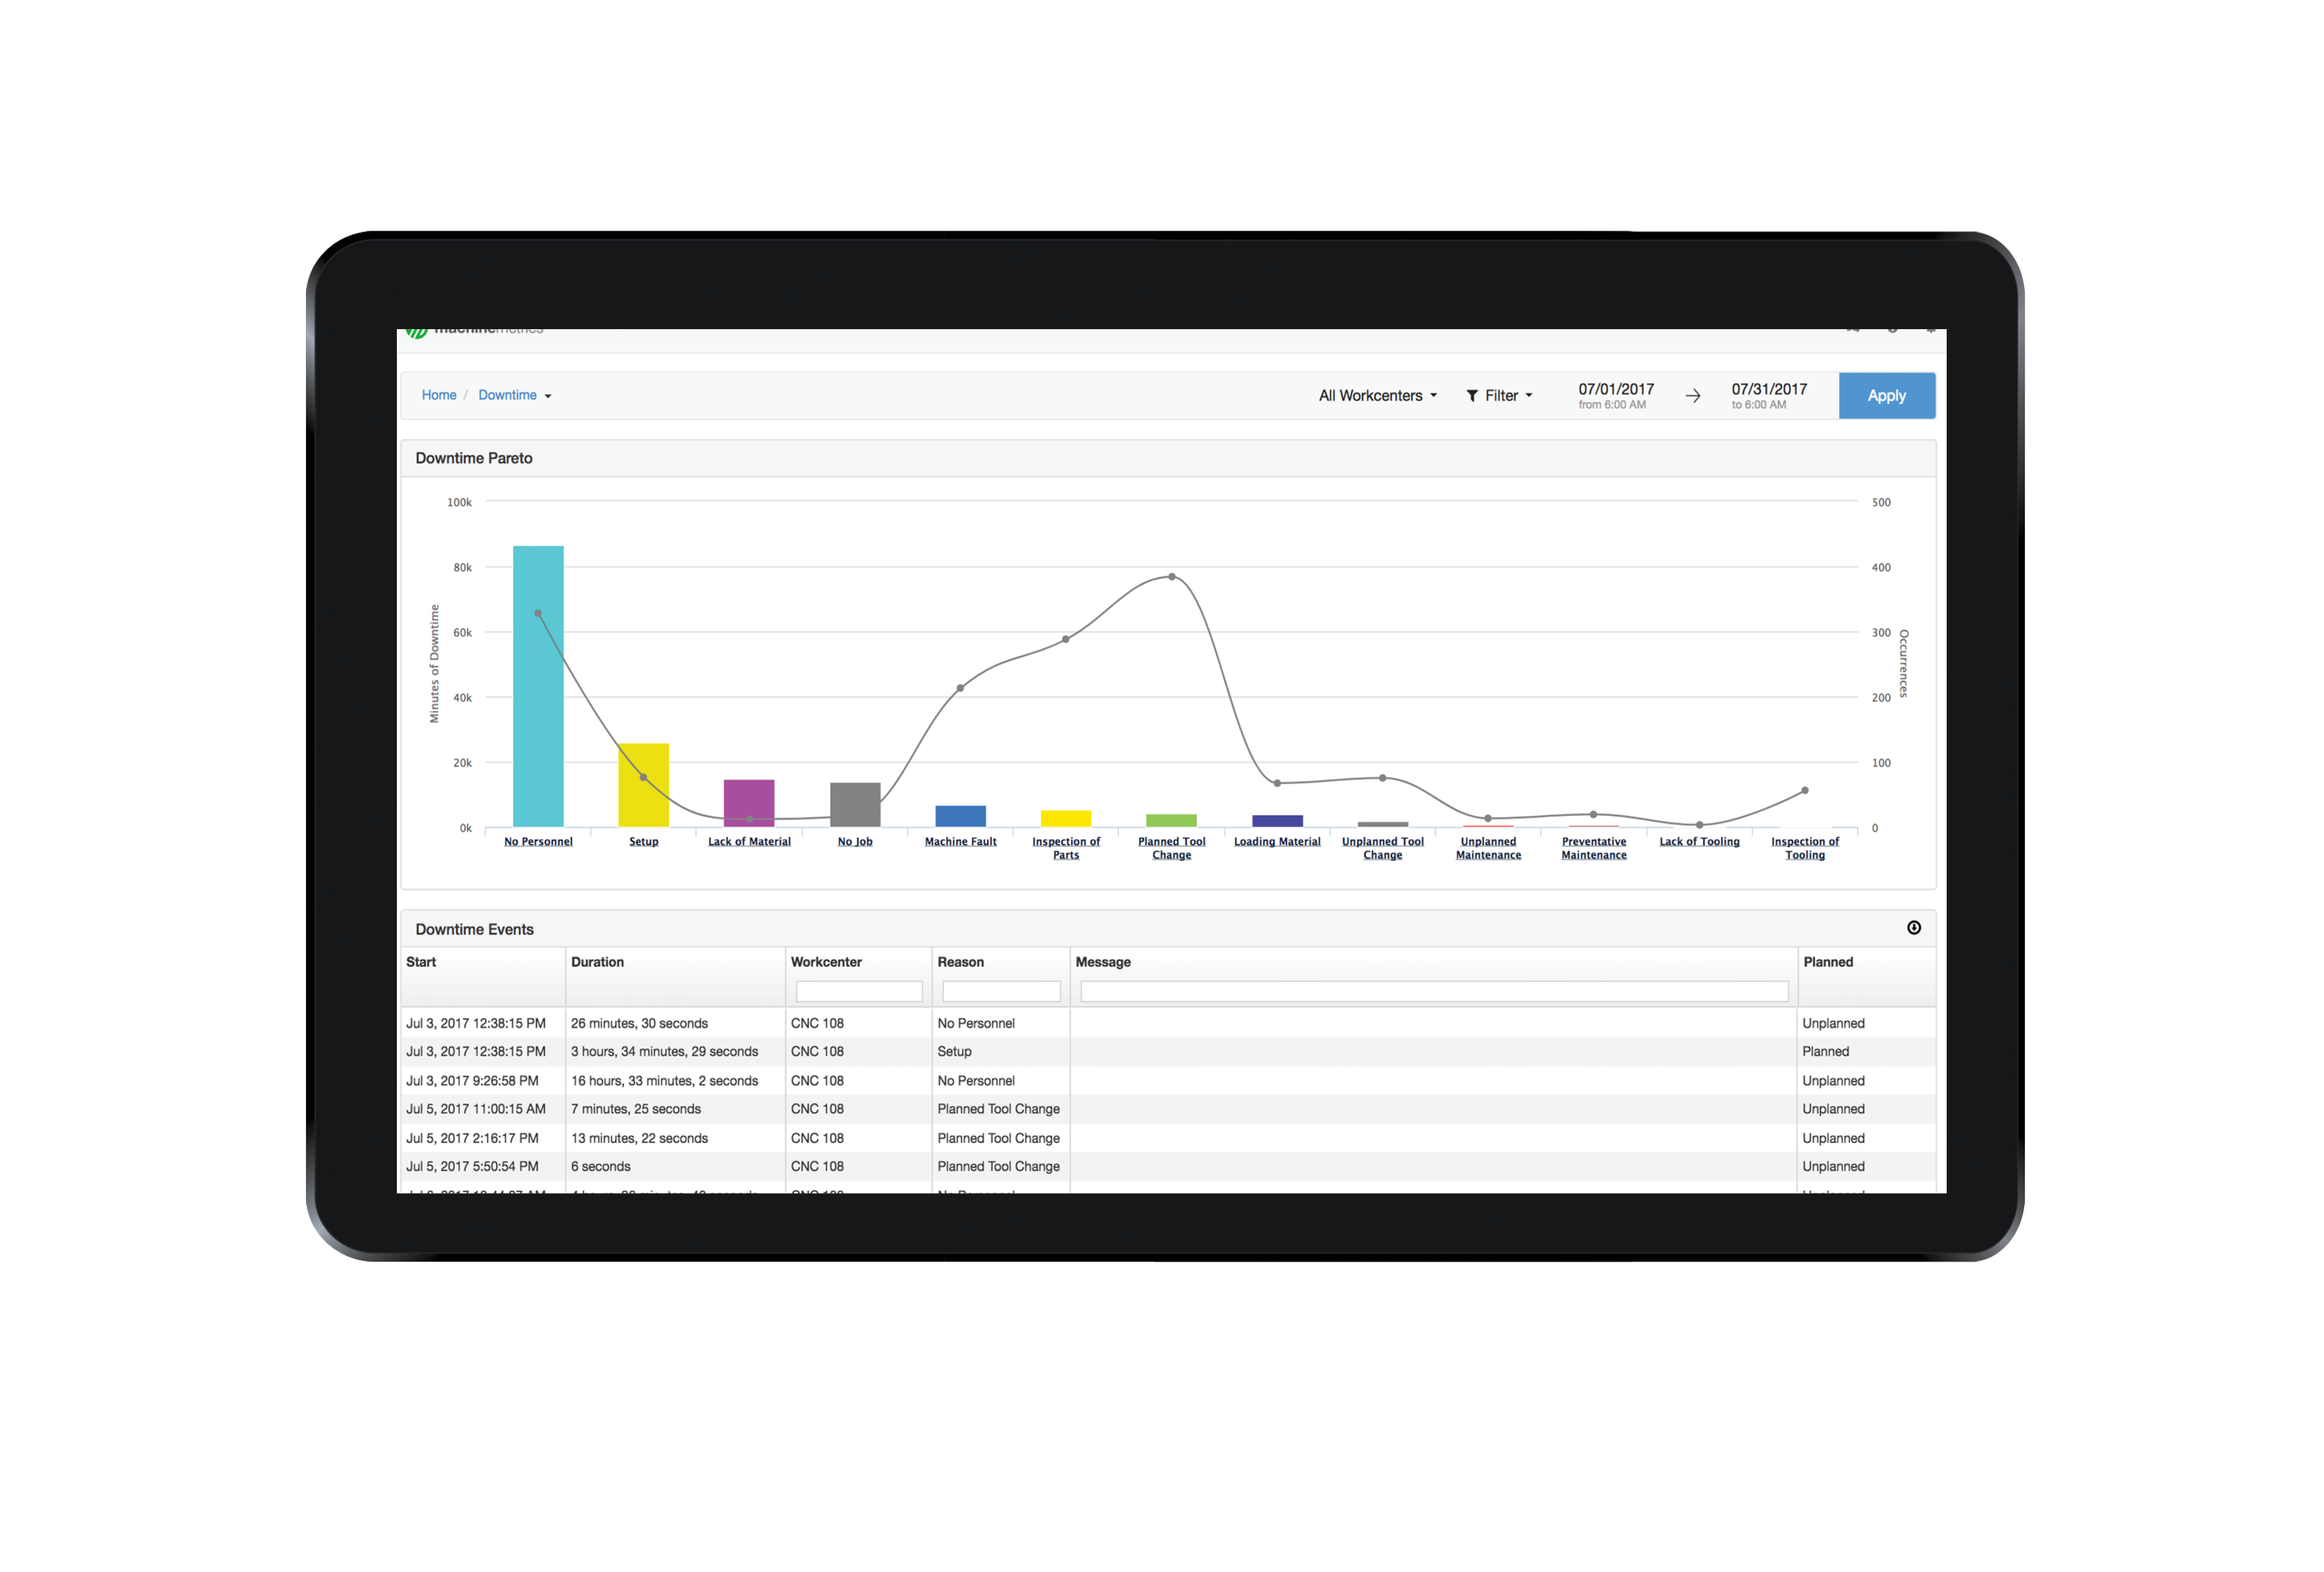 Above is an example of a Pareto Chart produced by operator feedback within the MachineMetrics app. The bar height represents the total amount of time consumed within a given period at your shop by each issue. The points above represent the number of occurrences of that issue.
In the above example, lack of personnel is clearly driving downtime (based on the number of minutes and the number of occurrences). You can also see that planned tool changes are their highest occurrence of downtime but do not necessarily take up a large amount of time. Understanding the relationship between number of downtime occurrences and actual length of that downtime will help a company decide the most effective ways to improve their process.
Gathering data is the key to solving problems. Your “gut feel” can be way off base. Using MachineMetrics will help you hone in on those problem areas that might otherwise be elusive. If Changeovers are your biggest source of downtime you can look at reducing the time it takes to perform one. You can also take it a step further and use the downtime data to look at which changeovers are the biggest pains. You may be able to plan longer production runs of a certain product to minimize the number of changeovers to that product type.
If unplanned downtime based on machine issues is causing headaches, you can implement a Preventative Maintenance Program. Using data you can predict when a part will fail and replace it before it does. If the data shows that multiple parts of a machine will likely fail within weeks of each other and it takes hours of disassembly to gain access to that machine element you can save time by replacing them all at once.
If you see massive variation in downtime by shift, you may have a personnel issue on your hands or they may just need retraining. All too often we put a band-aid on something to get a production line going again without taking the time to find and address the root cause of the problem. By getting to the root cause of the downtime we may be able to stop it in the future.
Conclusion:
The first step to solving any problem is defining the problem. For downtime, knowing when, where, and how downtime occurs is essential to knowing how to prevent it. An early step toward reducing unexpected production backups or outright downtime can be achieved by carefully and accurately tracking when and where downtime occurs. With MachineMetrics, we've made downtime tracking easy and user friendly so you can get to the bottom of your downtime issues and have a better understanding of how to improve your process.
Ready to empower your shop floor?
Learn More

.png?width=1960&height=1300&name=01_comp_Downtime-%26-Quality_laptop%20(1).png)


.gif)


Comments