
Book a Demo of MachineMetrics
The leading platform to collect, monitor, analyze, and drive action with machine data. Set up time with a product specialist to learn how we can help your operation.
Ready to empower your shop floor?
Learn More.svg)

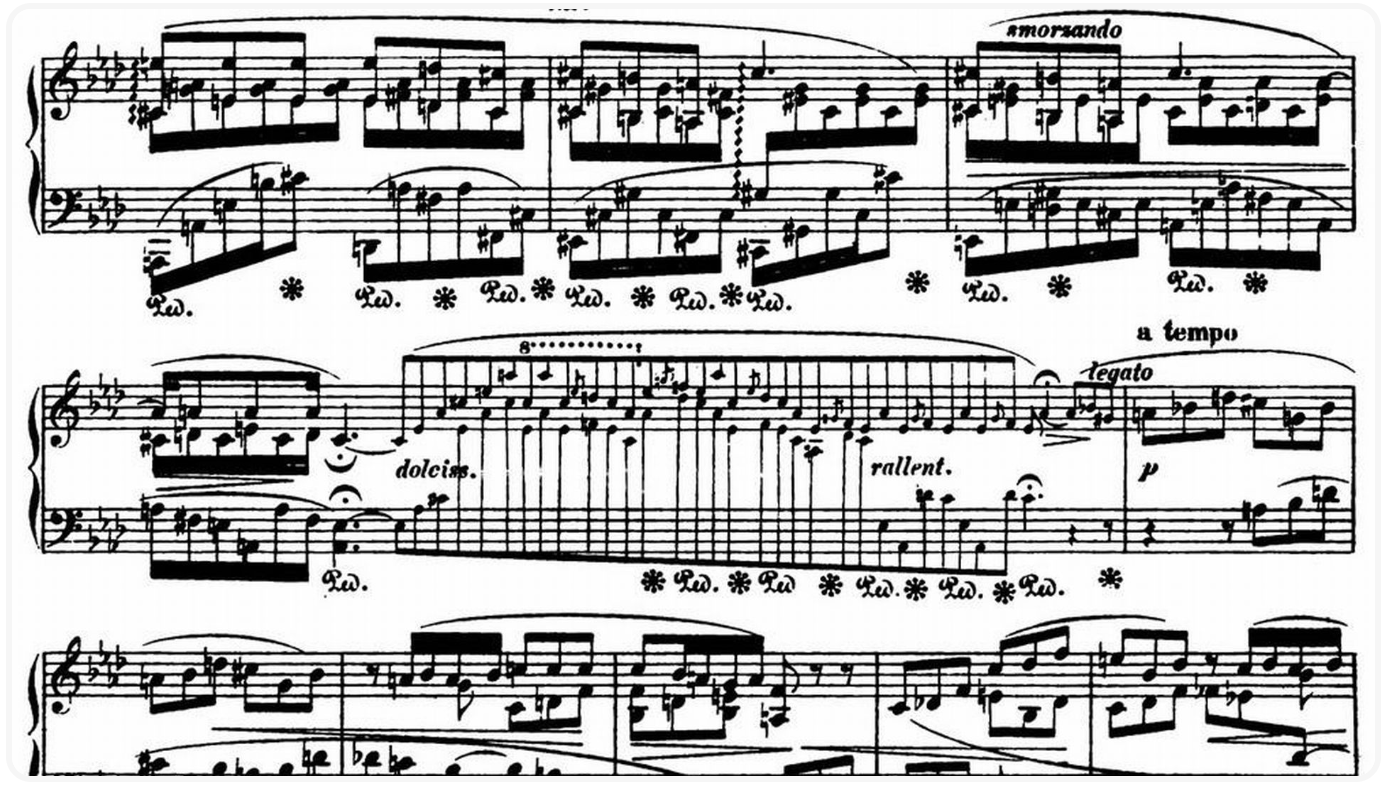
Imagine you’re trying to learn a new tune on the piano, but the sheet music only has one note out of every ten. Wouldn’t that be pretty hard?
That’s what it’s like learning what your machine is doing with data that only plays a few notes from the entire piece. Just like Chopin, a machine writes complex, nuanced melodies that get shortchanged when an incomplete picture is represented in the notes it plays, the data.
And sometime in the course of the last few years, we realized that the sampling frequency of our normal adapters was great for applications like dashboarding, benchmarking and certain ad-hoc applications similar to what we’ve detailed in our previous blog posts. For example, low-frequency data can accomplish condition-based monitoring on the motor temperature of a machine-tool, because temperature typically doesn’t fluctuate more than every half a second. But temperature isn’t a complex melody; it’s like playing the bass-line to a slow-jazz song.
Trying to do condition-based monitoring on say, spindle load, however is something we can’t effectively accomplish with our current sampling rate. This is primarily because we were not capturing enough artifacts in our data to accurately represent dynamic and continuous phenomenon on machines. We consider “dynamic and continuous phenomenon” to be any physical process on the machine that spans over a period of time and has nuanced, rapidly changing characteristics, like the load on the machine as it cuts through a piece of metal.
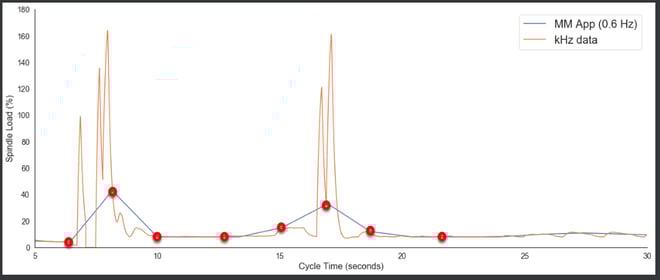
A simple demonstration of this is below, noting that we see only a very rough sketch of what’s going on, on the machine (like the bass-clef portion of a piece of music), and not the actual operations of the machine itself. The blue line represents what we currently sample (low-frequency, ~0.6 Hz), while the orange line represents a 1 kHz sampling rate of the same part. The red circles highlight the points on the high-frequency line that are currently being sampled.
Because of this, we knew that in order to dive into any sort of deeper work, we needed to establish a new and robust stream for data that actually captures all the artifacts on the machine. At the very least, we are gathering better ground-truth data at this point. The ability to deliver truthful data to our customers is intrinsically valuable, regardless of any applications that may come of it. Only hearing the left-handed portion of a piano sonata deals great injustice to the composer’s intention behind the piece, just like analyzing only the low-frequency portion of a machine-tool’s speeds and feeds leads to an incomplete picture of the full beauty of its operations.
Performing advanced analytical work with under-sampled data would be disingenuous at best, and hazardous at worst if put into production in a critical application. As stewards of data, we felt it was our duty to represent the state of the machine as accurately as possible, and devote resources into doing so for the betterment of the industry as a whole.
Why do we need to get it from the control?
If you conduct a literature review of predictive maintenance systems in manufacturing, you’ll see that most, if not all, solutions advocate for third-party sensor installations. Aftermarket sensor installations can be expensive, difficult to standardize, and subject to degradation. Where do you place the sensor, and what happens when it gets bumped out of place? Can your customer install and tune the sensor themselves? Or do you need to charge them a per-diem to go out there every time it needs to be adjusted?
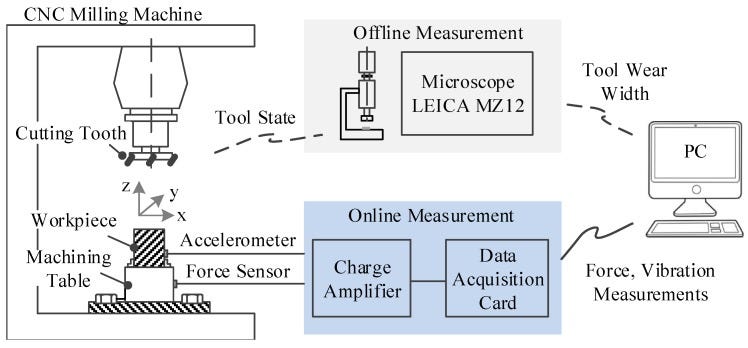
Compounding this problem, many of the solutions developed were created and tested in controlled environments, making them unrealistic in most real-world scenarios. A side-effect of this is that a great number of preventative maintenance systems require the disassembly and reassembly of machining tables to accommodate the required sensors [1]. Such invasive installation procedures are often not permitted in production environments, as altering machining tables will void the warranty of machine tools [2]. Finally, many current solutions advocate for installation of sensors inside the cabinets of machine tools, which in most real-world applications requires resilience to hostile machining climates involving coolant, lubricant, and metal chips. The scenarios which previous solutions were developed for are therefore not realistic in all but the most tame, laboratory environments.
Though we also have sensor-based integrations, MachineMetrics largely gathers data directly from the control of the machine, bypassing the need for additional sensors and the complications involved with them. We do this because it’s more scalable and enables customers to self-install our product; it’s much easier to hook-up a monitoring solution when one merely needs to plug-in our edge device to the Ethernet port on the control. The implications of this strategy are great, as our product and algorithms become self-propagating and coverage often grows without our strict intention. These new data sources are ubiquitous and standardized across almost all machine tools and represent a rich, untapped resource to draw novel insights from. It’s a way of democratizing Industry 4.0, an anathema to the old ways of on-premise, siloed installations.
How did we go about getting high-frequency data, and why isn’t this done regularly?
Nearly all the people we’ve talked to in the industry have stated that they sample control data at 1–4 Hz. The normal APIs for extracting control data for almost all manufacturers only allow sampling at this rate. We observed this to be the case in literature as well, with sampling rates topping off at ~40 Hz for especially dedicated researchers.
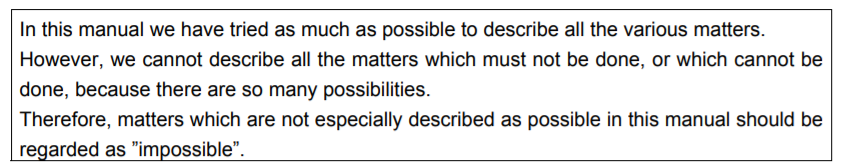
We spent a large portion of last year figuring out how to move past this constraint, with hours of time poring over machine-tool and control manuals poorly translated from Japanese into English. It wasn’t easy.
After much research and investigation, we were happy to discover that a major control manufacturer, which produces a large amount of controls for CNC machine tools, has a high-frequency channel for key metrics like spindle speed, load, commanded speed, temperature, and current. We were even happier to find that about half the mills and lathes we are currently on have this particular type of control, so whatever solution we were able to develop would immediately impact a large portion of our customers.
The high-frequency channel streams data out at exactly 1 kHz, which was designed perhaps because mills tend to spin at ~10,000 RPM max, which is at most a few hundred Hz. When data is sampled at 1 kHz, the Nyquist frequency, or effective sampling frequency, is half of that. This means that harmonics that manifest at 200 Hz need a 400 Hz sampling rate to be fully represented, else aliasing will occur. Add a comfortable buffer on top of that, and you get the 1 kHz.
Idiosyncrasies of Enabling High-Frequency Data
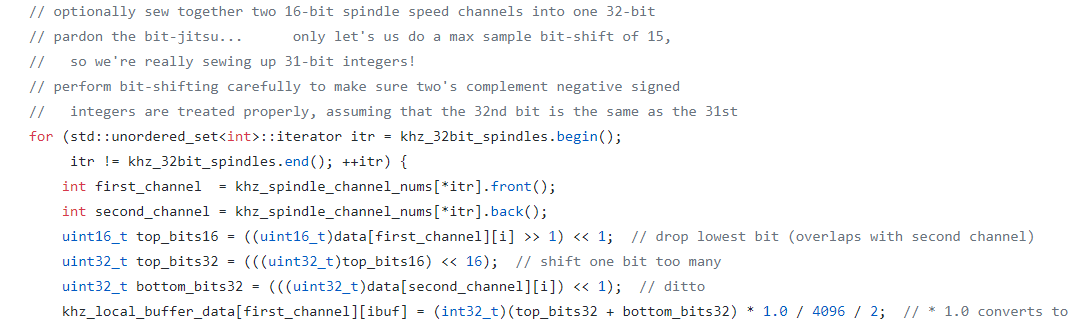
Why hasn’t this been done before? In addition to having the high-frequency capabilities buried deep inside the control API and not readily marketed, it should be noted that there were various idiosyncrasies of the data collection process which needed to be accounted for with our own proprietary heuristics engine. Some of the problems we ran into are cited as examples below, but the issues were myriad and sometimes just required days of trial and error.
For example, raw data from the machine is encoded as 32-bit integers. Unfortunately, data extracted via high-frequency functions from the API is downsampled to 16-bit integers. This necessarily loses information on high-precision quantities, and runs the danger of causing base-2 analogs of things like 12,345 being converted to 345. The control manufacturer here provides a shift parameter per metric, which allows us to chose which block of 16 bits we would like to keep. For example, for spindle speed, the default shift=0 corresponds to 1 RPM per 4096 units. That gives us a dynamic range of +-8 RPM with resolution of 1/4096. Choosing shift=11 instead gives us a dynamic range of +-16,384 RPM with resolution of 1/2. Without playing around with this shift parameter, we never would have been able to obtain accurate data.
Another idiosyncrasy arose from disconnects occurring between the raw data output via the API and the actual physical activity on the machine. In particular, spindle motor speed output from the API can differ from actual spindle speed on the machine by a gearing factor. This gearing factor is output with another API call, and only the combination of these two factors would give us an accurate representation of actual spindle speed.
It is likely that these peculiarities were caused by haphazard and disjointed design of the API and even the PLC/CNC architecture. Because advanced machine monitoring is a relatively new phenomenon, manufacturers may have never intended for these APIs to be used externally or in such a manner, and therefore did not design for our novel usages. The original purpose of the high-frequency channel on this control manufacturer was actually for a product called “Servo Guide”, which allows customers to get quick samples from their machines at high-frequency in order to do diagnostics. Because we are re-adopting this feature for our own purposes, we are fairly confident that MachineMetrics has run the longest experiment in the world in using this control manufacturers’ high-frequency capability.
With a combination of domain knowledge and the building of gradual familiarity with the API, we were able to intelligently account for these quirks and extract meaningful information from an otherwise cryptic platform.
Even outside of technical considerations, other machine monitoring companies have defaulted to using sensors instead of control data, which gets around the issue of dealing with weird control APIs, but introduces the problems detailed in the previous section.
What happens if you try and do things without high-frequency data?
There are two immediate and simple use cases that we can demonstrate with high-frequency data. The first is monitoring the effect of offsets on load. The plot below shows load over many part cycles, and each time there’s a jump, that’s when the operator is making an offset on their machine. Displaying this information could be useful to operators to make sure their offsets are keeping load within an acceptable range.
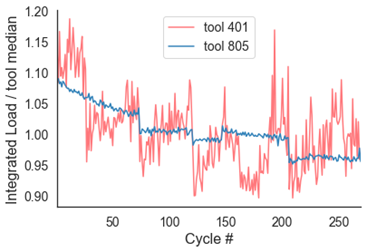
When we try and do the same analysis on low-frequency load, we get the following result: random noise. This is because under-sampling removes critical artifacts from the load signature, and when analyzed over time, patterns become obfuscated.

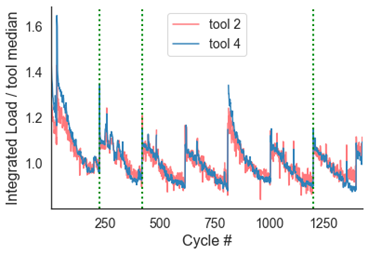
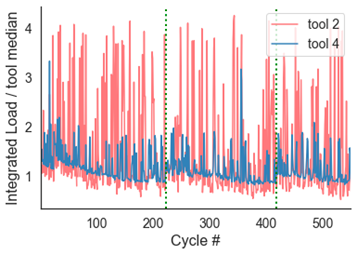
A second possible use-case is in monitoring the effect of bar changes on load. Below is load over ~1000 part cycles on a Swiss CNC. You can clearly see the ramping down pattern in load as a bar gets shorter and shorter. This is because it takes less energy to spin a small bar vs. a large bar. As the bars get changed over, the load jumps from trough to peak. This information may be useful in tracking, displaying, and alerting operators of the number of bars consumed over time, and can even be used in a probabilistic model of when bars are about to be worn out. An immediate manifestation of this in our product can be in automated downtime labeling — instead of having our customers manually select a downtime category, we can now label it for them when we detect this phenomenon. It should be noted that the green dots are where barfeeder alarms are triggered, indicating that the machine needs to be reloaded.
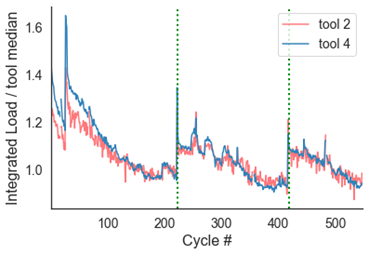
Zooming into the first 500 cycles, we see that load over time exhibits a nice, predictable pattern on the left (high-frequency), but a pattern highly corrupted by random noise on the right (low-frequency). It would be significantly more difficult, if not impossible, to count the number of bars consumed or predict when a bar was about to run out with the data on the right.
Next Steps
As we move towards deeper investigation of high-frequency data, we see two major research paths we can take.
It is likely that (2) will inform (1), but we are looking forward to unlocking the secrets of high-frequency control data. As we unravel the mysteries of machine-tools through mining massive amounts of high-frequency data, we discover beautiful and sonorous sonatas hidden deep within the intricacies of their data footprints.
It’s an exciting time to be doing research in manufacturing!
Sources
[1] Learning to Monitor Machine Health with Convolutional Bi-Directional LSTM Networks. https://www.ncbi.nlm.nih.gov/pubmed/28146106
[2] DMG Mori Limited Warranty. https://us.dmgmori.com/resource/blob/128176/45cf01b93634fb6c53ccf4ab3a51908b/dmg-mori-limited-warranty-us-pdf-download-data.pdf
Ready to empower your shop floor?
Learn More

.png?width=1960&height=1300&name=01_comp_Downtime-%26-Quality_laptop%20(1).png)
Comments