
Book a Demo of MachineMetrics
The leading platform to collect, monitor, analyze, and drive action with machine data. Set up time with a product specialist to learn how we can help your operation.
Ready to empower your shop floor?
Learn More.svg)

In the fourth installment of this series, we’ll take a look at some examples of anomalies we caught in live machining environment. We’ll then discuss how we put this into production.
We identified five distinct categories of anomalies.
Example 1: Preceding Tool Failure
The original purpose of taking this approach is because we hypothesized that machines experience anomalous behavior before failure. We recorded several cases of this happening — here we’ll briefly describe an example case.
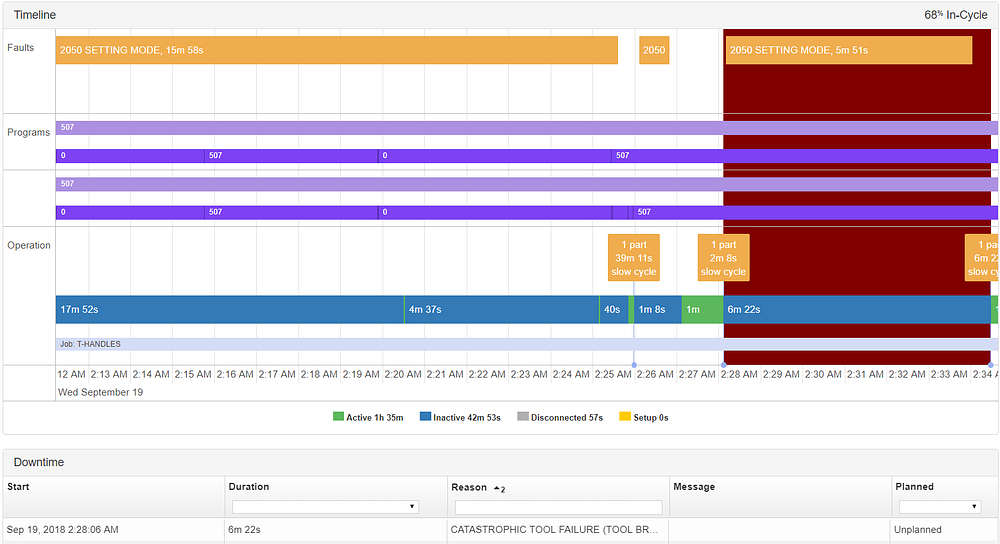
An anomaly was triggered at 2:25 AM, and was followed 3 minutes later at 2:28 AM by a catastrophic tool failure.
If we go a little deeper to see what was so different about this part, we can easily visualize what happened. Let’s work backwards from the clustering to the part signatures to diagnose this issue.
The Clustering Level
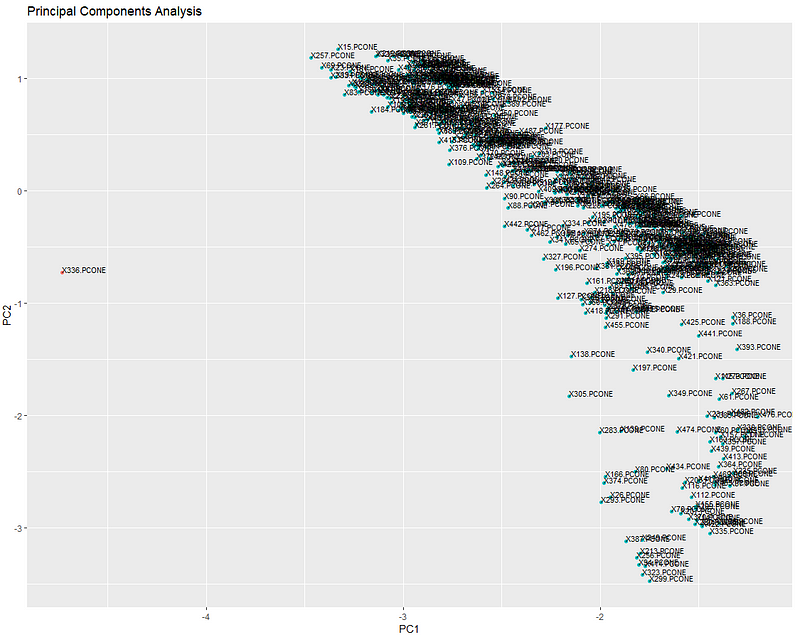
From 10 PM to 6 AM, around 450 parts were made. The plot above shows the relative position of their part signatures when projected onto a 2D plane. As we can see on the clustering level, there’s clearly an anomaly here. All the other parts are clustered together, and DBSCAN easily isolates the anomaly, floating out there all alone in space. Let’s move one level deeper.
The Time Series Features Level
The cluster plot above is generated from the time series features that are extracted from each part signature. Let’s see where the anomaly’s features fall relative to all the other parts (highlighted in purple).
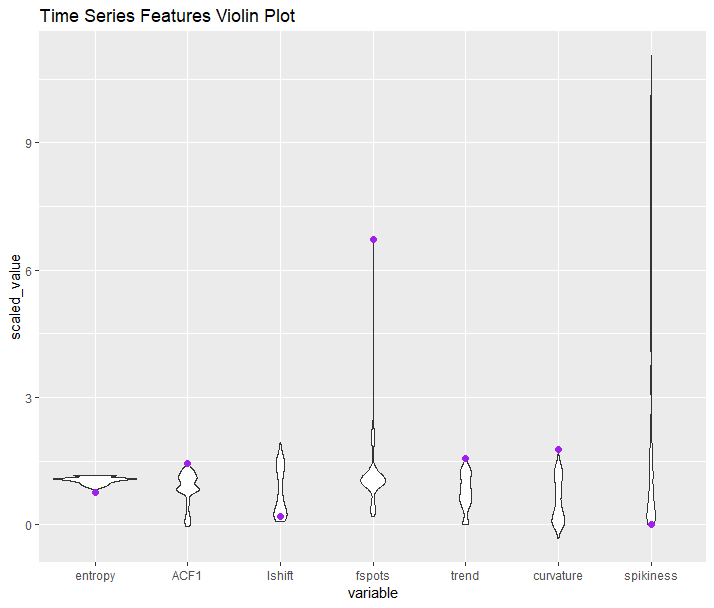
We can see that all characteristics of our anomalous part are on the extreme ends for these metrics, which explains why it’s so far out from everything else. Digging one level deeper..
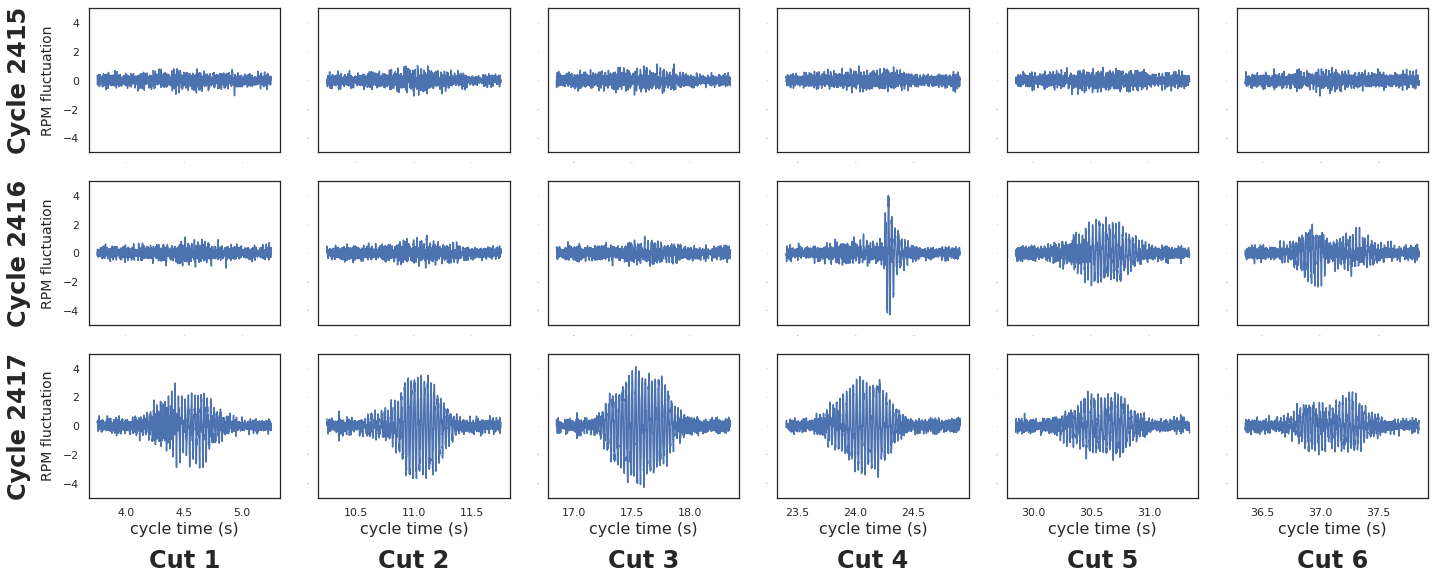
The Part Signature Level
What does this part signature look like compared to everything else? Below we animate the 50 part signatures around the anomalous part. Once again, it’s pretty obvious which one the outlier is.
The implications of predicting tool failures are significant. For one, downtime and cost is minimized by saving money on operator costs and tool changes. It can also be reassuring to know that there’s an algorithm looking out for areas of concern on your manufacturing floor.
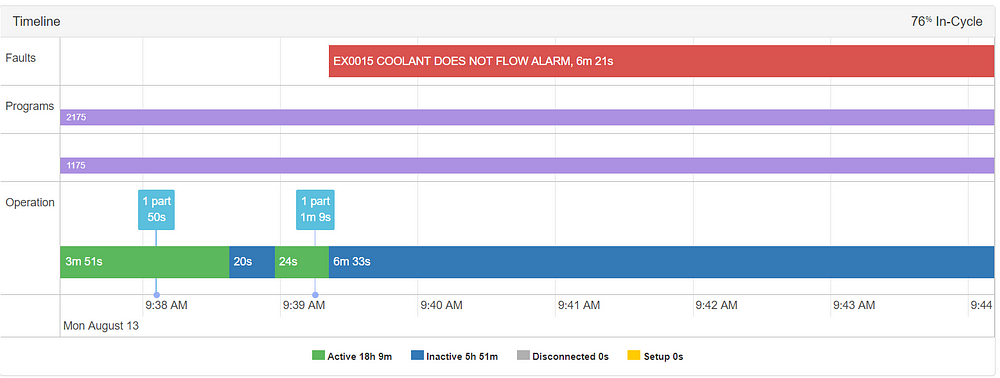
Example 2: Detecting Coolant Out
On this machine, an anomaly was triggered at 9:39 AM, with a “coolant out” alarm immediately following. Operators would have been notified immediately before the machine ran out of coolant.
One might ask — what value would this be if I would have gotten an alarm anyways a couple seconds after?
The value-add here is that operators don’t always pay attention to alarms, often having alerts sent to them only after a prolonged period of downtime. Instead of letting the machine run idle until he received an alert (or noticed it idling while walking around), the operator could reduce total downtime on the machine by responding to the anomaly text.
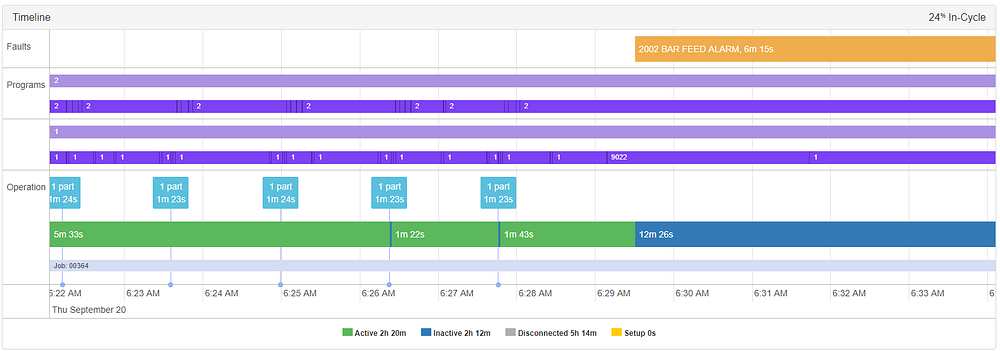
Example 3: Preceding Barfeeder Alarms
In the final example of this category, the operator received an alert ~6 minutes before a “BAR FEEDER ALARM”, at 6:23.35 AM. Let’s take a look at this on the timeline.
Diving into the principal component space, let’s see what this looks like.
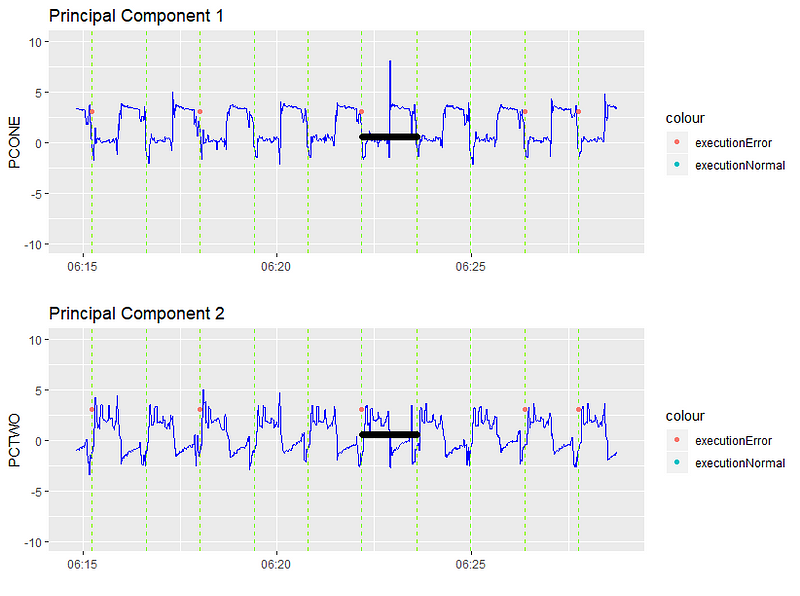
The anomaly is highlighted in black. We can clearly see a spike in the first principal component. Let’s dig even deeper into the actual signals themselves to see what happened.
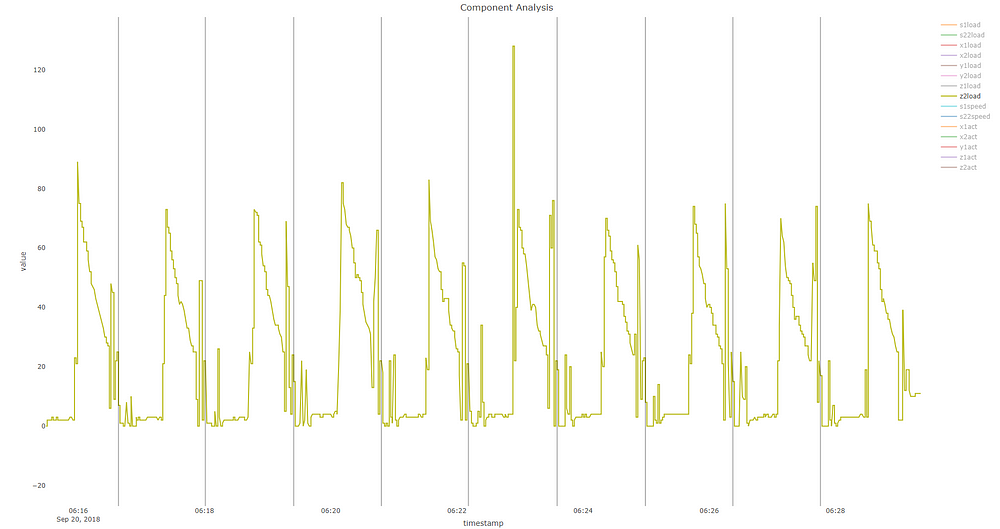
Looking at just Z2 load, there appears to have been an odd pertubation at about 6:22.56 AM, evident by the spike in load from a peak of 80 per part to over 120 for this one part. In addition to that, the patterns of the wave around that time also differ — you can see clear inconsistencies with the other signals around this area. Of course, due to the nature of PCA, it’s probable that other signals not shown on this graph contributed to this as well in ways not obvious to the naked eye.
Unsurprisingly, we also found anomalies triggered at the same time as alarms. Alarms are built in by OEMs to alert operators of something out of the ordinary (as are our anomaly alerts, so it’s no wonder they often coincide). This can be a benefit, since as previously mentioned, customers don’t always pay attention to alarms. An alarm+anomaly may merit more attention, especially if there are dozens of lay alarms every day.
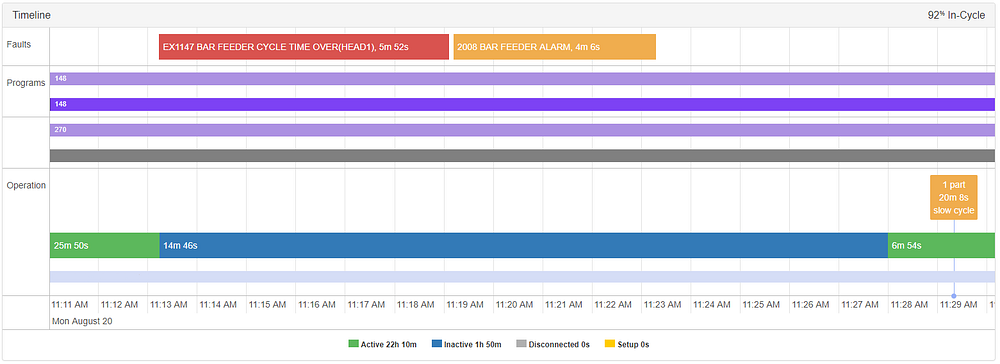
These alarm-anomaly pairs, which indicate that the machine operated quite differently, may also be more severe than procedural alarms. In the instance below, an anomaly was triggered at 11:29 AM, coincident with a “barfeeder cycle time over” alarm, which starts when a barfeeder reaches the end of its material.
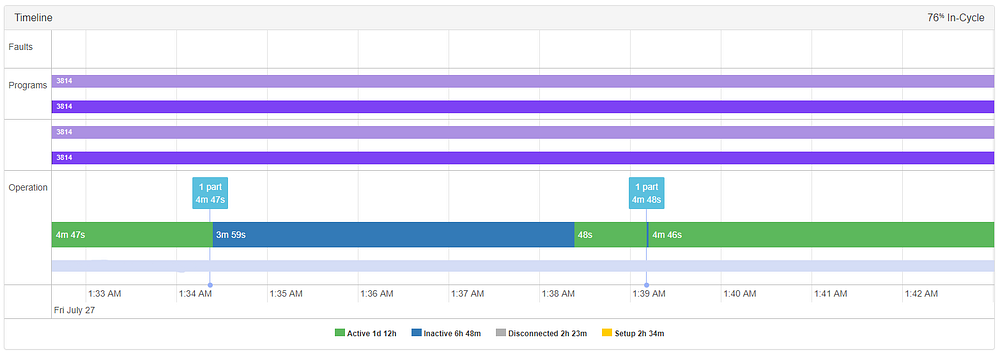
As a bonus side effect, we also uncovered a couple internal bugs that manifested themselves as anomalies on our machines. In the example below, we found an odd instance where the machine was actually active while it was technically being marked as ‘inactive’. This caused the machine to record an anomaly for the part created at 1:39 AM.
This is because we only read data into anomaly detection when the machine is active, and we triggered an anomaly upon seeing a truncated part signature. After confirming that the machine was indeed active in our raw data stream, we were able to quickly pinpoint and remedy the bug, which was that our data pipeline was dropping observations at times.
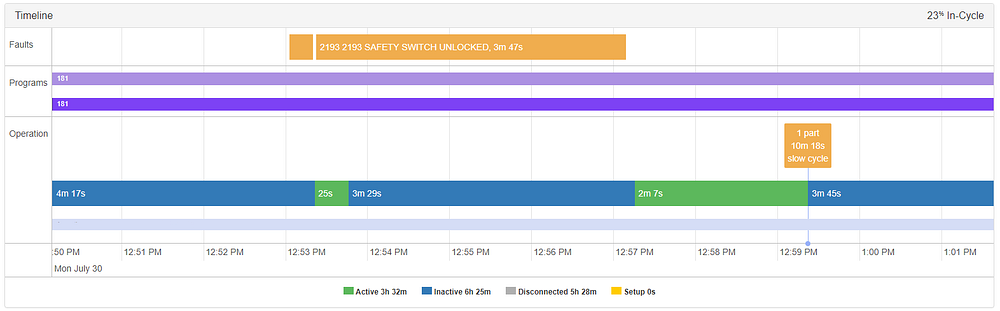
Not all tool failures are preceded by anomalies, and not all anomalies coincide with or precede tool failures. In this instance, a “safety switch unlocked” alarm is triggered because the operator didn’t have the door fully closed before starting the machine, with an accompanying anomaly at 12:59 PM. The machine remained inactive while this was happening as an automatic saftey precaution. Though not an impediment to operation, a floor manager may want to know when this is happening (especially if it’s repeated) to encourage better safety practices.
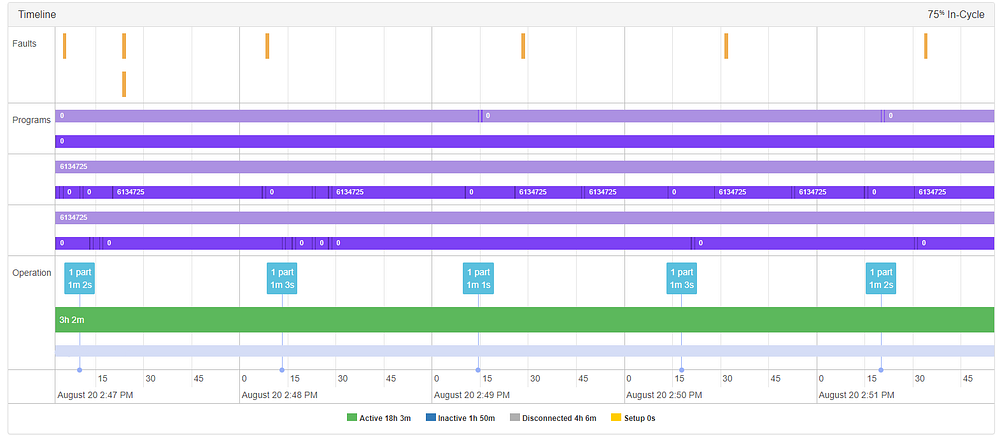
As always, there are edge cases which don’t fall within the scope of what we designed our system for. In the example below, an anomaly was triggered at 2:49, seemingly without rhyme or reason.
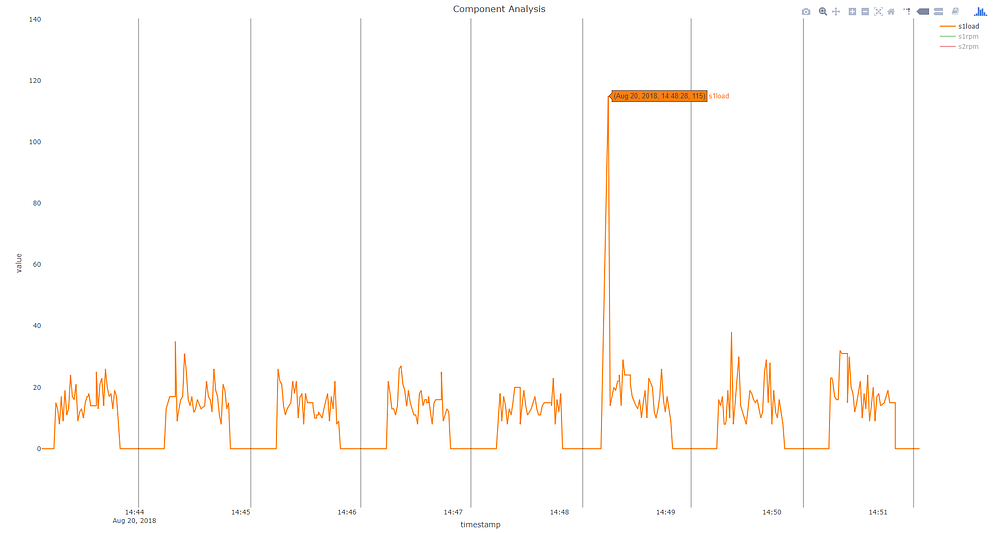
Upon deeper investigation however, we see that there’s a s1load (spindle 1 load) spike during that part creation cycle. This spike, which indicated the machine was operating at 115% of rated load, was enough to trigger a significant difference on the part signature level. In this case, it was within the normal operating boundaries of this machine, causing no harm or foul.
As we gather validation data from our customers, we can tune our algorithms to be more sensitive towards “useful” anomalies, and less sensitive towards superfluous ones. Feedback should start to pinpoint which of the time series attributes point us towards more interesting anomalies. We can also do A/B testing, releasing different versions of the algorithm to certain customers to see if we get more favorable feedback. Over time, marginal improvements can result in significant accuracy gains.

In the future, we plan to combine machine learning with a domain-knowledge “rules-based” anomaly filter to exclude situations we know aren’t interesting. We’ll publish an epilogue with this and some more examples of tool failure in the near future.
For our pilot, we decided to simply dockerize the R scripts we used for data cleaning and clustering. These scripts do all the heavy lifting described in parts 2 and 3 of this blog, and we only needed to wrap them in a container and make some automation changes for them to be fully functional in production.
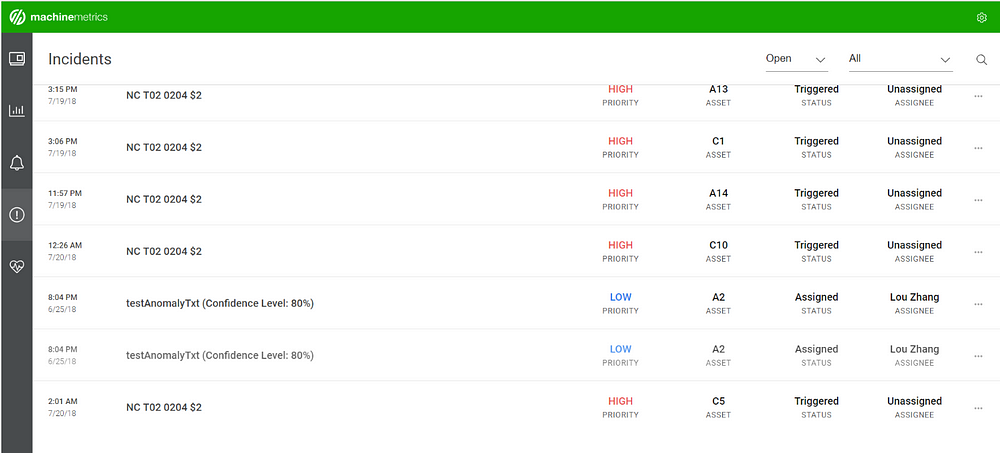
The program in production looks back and queries data for the past six hours, detecting part cycles and establishing a rough region of normal behavior. Once part cycles are identified, we query data continuously and detect anomalies in real-time. After detecting an anomaly, the anomalous part is recorded and an SMS is sent to the operator, in addition to generating an incident in the customer’s homepage.
The algorithm also has the capability of detecting when a new part type is being started, as we collect a “program_code” field that indicates which G-code program is running. Switching the program will clear the anomaly cloud and restarts the process altogether.
In the sped-up example below, part 262 is an anomaly, falling well outside the main cloud. Upon recognition of the outlier, an alert is immediately triggered.
We wrapped this all within another script that pulls machine ID’s from our database and bundles them into small groups of 15–20 machines. Each group runs through their 15–20 machines sequentially and applies the full process to each machine. This does introduce some delay in when recipients get alerts, but still allows us to fully record and diagnose anomalies for further tuning (which is ultimately the goal of our pilot).
We trigger this all with a bash script, which accepts arguments that tweak the parameters of anomaly detection. This is especially useful during the pilot stages as hyperparameter-tuning largely needs to be done in a live environment. We deal with a unique problem because it’s hard to verify anomalies with historical data — customers often don’t remember when a machine failed or experienced weird behavior. We had a few examples to help get us going, but we didn’t collect information on tool failure en-masse in the past.
To expand on that, we know when alarms occur and can correlate them to our anomalies, but this isn’t one-to-one. Machine OEMs and customers define these alarms, which happen when the machine is faulting out, because of a safety reason, or when a cautionary alert is merited. However, it’s difficult to untangle when alarms actually cause downtime because of the lack of standardization, much less whether this downtime is due to the alarm or another reason.
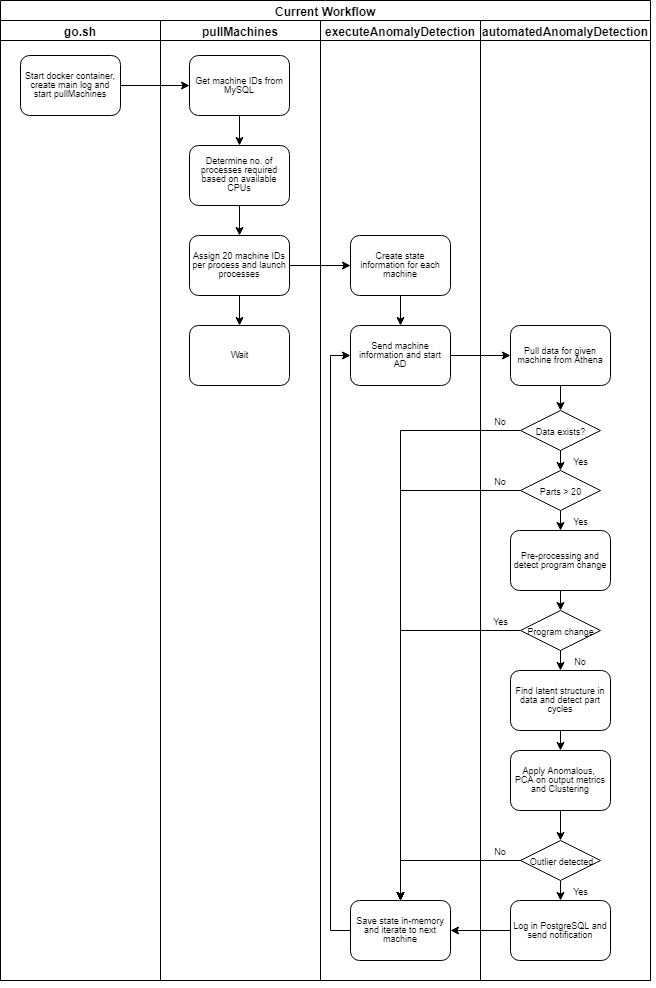
For reference, a full diagram of productionalization is outlined below for those interested in more technical considerations (or if you really like flow charts)..
We should note that on the front end, we designed a UI to allow customers to mark each anomaly as either “anomalous and useful”, “anomalous and not useful”, or “not an anomaly” to gather validation data to further refine our methods.
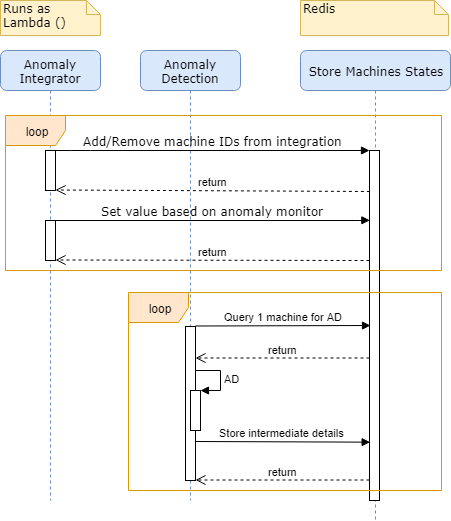
As the process evolves, our plan is to take out as much cost as possible while increasing robustness. We plan to replace dockerized R scripts with an AWS Lambda function that ingests data directly from our data stream and does all the processing there. There would be no need to pay query costs nor EC2 costs; processing would be quicker and there are less pieces that could fail. This would also allow us to deploy this on-premise for facilities which do not wish to have their data sent up to the cloud.
We also add the ability to save details of machine states, and the machines we want this run on, in Redis.
In full production, there would be a fleet of lambdas, each lambda running anomaly detection for a small group of machines. Once a lambda is finished processing a micro-batch, it stores details of the machine states. Upon resuming, it can pick it up immediately with all corresponding details for the machines it had been assigned to.
.
If you have any suggestions, feel free to send us a message!
Thanks for reading our series on anomaly detection. To find out more about MachineMetrics, you can visit us here: www.machinemetrics.com
Ready to empower your shop floor?
Learn More

.png?width=1960&height=1300&name=01_comp_Downtime-%26-Quality_laptop%20(1).png)


Comments