
Book a Demo of MachineMetrics
The leading platform to collect, monitor, analyze, and drive action with machine data. Set up time with a product specialist to learn how we can help your operation.
Ready to empower your shop floor?
Learn More.svg)

Have you ever heard the expression "out of sight, out of mind"? Sometimes ignorance is bliss. But in manufacturing, being out of sight and out of mind may mean losing focus on shop floor activities, and falling behind production goals.
Manufacturing has traditionally used visual tools to keep employees focused on production. And anyone who has been in the industry remembers the whiteboards, grid boards with tape and string, clipboards used for manual data collection, and other methods derived from or destined for Excel spreadsheet analysis.
These manual visual aids offer no real-time insight, are error-prone, and require a lot of labor to keep reasonably up-to-date. Many manufacturers continue to rely on manual data collection methods. By contrast, the modern connected factory has many data-driven visual tools at its disposal. From Human Machine Interfaces (HMI) to interactive manufacturing dashboards, today's smart factory with advanced production monitoring can help operators and managers visualize production status.
A production display board can be simple with just a few key metrics. It can also be more complex with a wide range of metrics designed to provide details to those on the shop floor and help them better understand the minute-by-minute progress of the day's work.
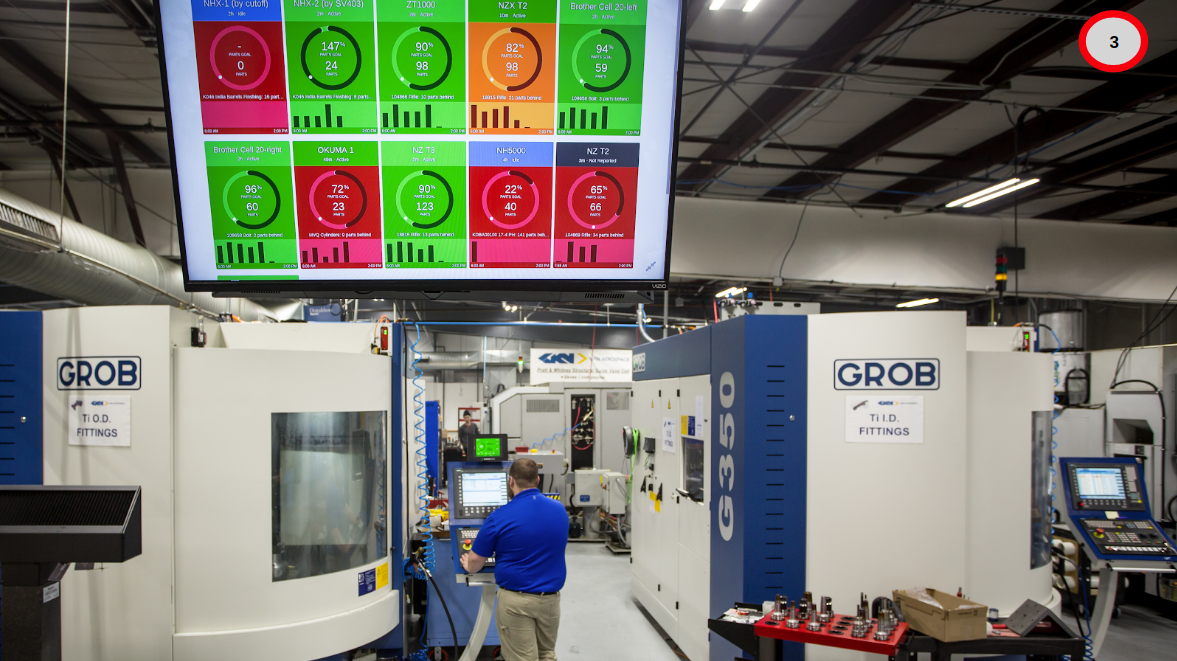
Functionality is always tied to a source, such as factory-wide monitoring software that updates production data. The production display board can show real-time data for companies with advanced monitoring systems and IIoT devices.
In this case, data is autonomously collected from machines and systems, and then propagated in displays across the shop floor.
Here are some available features on production displays:
Let's explore an example with the MachineMetrics performance dashboard:
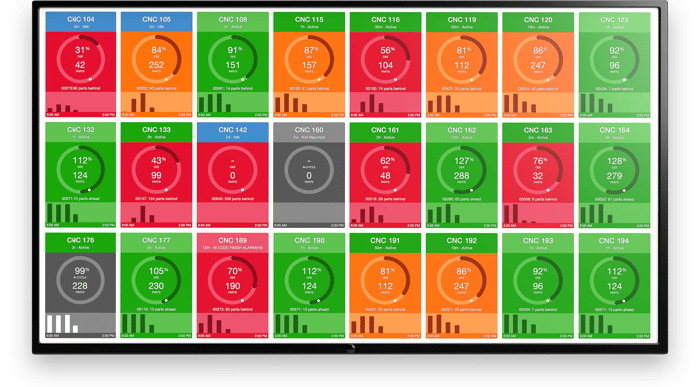
You will see that the dashboard is broken into individual tiles, each of which represents a single machine. The color of the tile indicates whether the machine is meeting, exceeding, or falling short of expected performance.
With this visibility alone, behavior changes, enabling customers to quickly achieve a 10-20% increase in utilization. Of course, deeper analysis can be done via time-series reports, and the display dashboard can be customized to make visible the most important information. For example, you can track part counts against your production goals or display real-time OEE.
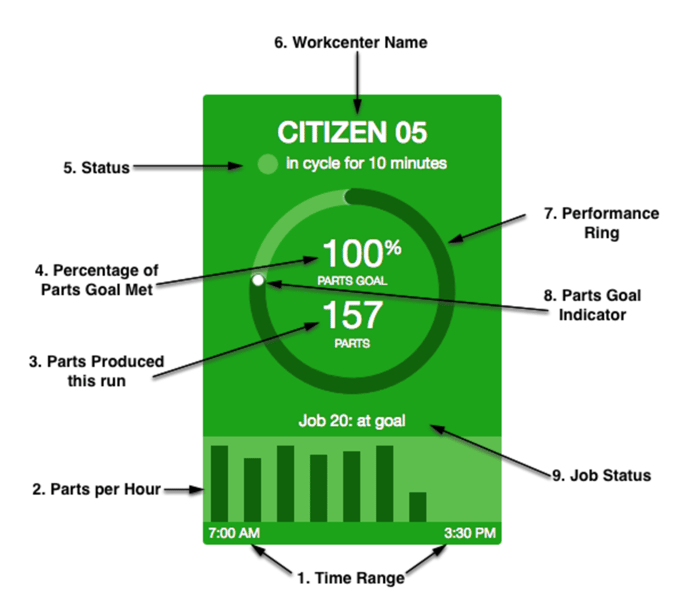
Here's a closer look at some of the features in each tile from the above dashboard:
Not all boards will have the same functionality. Some may show only a small number of KPIs. Others will show continuous or rotating KPIs by department and factory level. These boards help manufacturing efficiency by:
MachineMetrics provides a robust production monitoring solution for factory automation and IIoT enabled factories and shops. Using real-time data to display key metrics, employees have access to color-coded easy to read, intuitive dashboards out of the box. And manufacturers can customize these dashboards to show the most relevant and critical data in real-time across all display boards.
But production monitoring is just the start! With real-time, accurate production data, manufacturers can begin to enable process optimization and automation. Instead of simply knowing when machines are running or down, you can engage in more advanced analysis of production performance, such as:
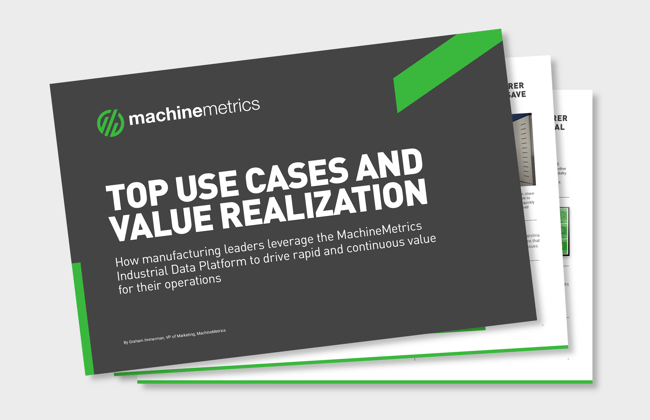
Explore some of the top use cases for MachineMetrics and how customers are quickly driving ROI in our latest guide:
Ready to empower your shop floor?
Learn More

.png?width=1960&height=1300&name=01_comp_Downtime-%26-Quality_laptop%20(1).png)
Comments