
Book a Demo of MachineMetrics
The leading platform to collect, monitor, analyze, and drive action with machine data. Set up time with a product specialist to learn how we can help your operation.
Ready to empower your shop floor?
Learn More.svg)

Manufacturing is a costly endeavor. Labor, raw materials, indirect overhead, and capital equipment are all large cost centers, and optimizing them is a goal of any manufacturing company. But one thing stands out among those costly line items. While all these areas have room for process improvement, utilization rates of machines can make or break all the others.
The scary part: The average manufacturer has a utilization rate of just 28%!
With poor utilization, labor and overhead costs rise. It also impacts raw material in the form of inventory that doesn’t move as fast as it should. And in many cases, it can spur companies to purchase even more expensive equipment to keep up with demand.
Wouldn’t it be better to figure out how more effective equipment utilization would make your machines run more efficiently? Let’s explore how we can make that happen.
Here is a simple and effective machine utilization formula:
(Run Hours / Available Hours) x 100
Also said as:
(Productive Machine Hours / Scheduled Machine Hours) x 100
Below are a few examples of how to calculate utilization rates.
If a machine in a single-shift CNC facility is scheduled to run eight hours a day, Monday through Friday, and due to setups, cleaning, breakdowns, and other operating tasks, only runs for a total of 30 hours, the utilization rate would be 75%.
30 Run Hours/40 Available Hours x 100 = 71% Utilization
In another scenario, in a 24/7 facility, the equipment would be scheduled with no idle hours, and the total available hours would be 168. If the machine runs 85 hours, the utilization rate would be 51%.
85 Run Hours/168 Available Hours x 100 = 51% utilization
This formula shows you how to calculate machine utilization. Now, you must find the optimum rate for the best equipment utilization.
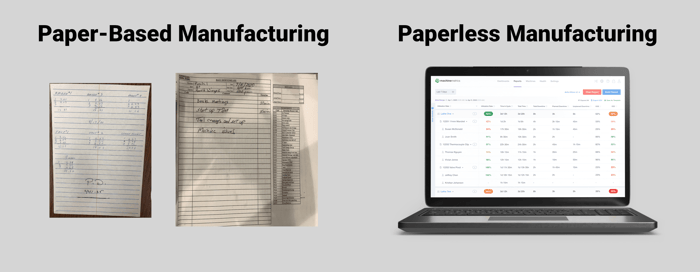
But this requires companies to know these numbers and track them accurately. It also requires a data collection system that is free from errors and bias. This is the challenge faced by companies still tracking production data manually. If the data is unreliable or in error, the utilization will be, too.
That means you’ll be making decisions based on faulty assumptions.
Knowing your industry and market is only part of the solution. Today’s manufacturing environment moves fast and is hyper-competitive. Companies are turning to machine monitoring solutions to gain control of their data with almost endless applications such as OEE software that measures utilization and other OEE metrics. These companies put real-time data to use in understanding utilization of machines, and make improvements based on the insights derived from the data.

With MachineMetrics, a production monitoring platform, connecting equipment to get the data flowing is easy. The platform easily connects to any make or model of equipment, ensuring both digital and analog legacy assets are connected.
Most importantly, MachineMetrics standardizes the data into a common model. This ensures the data is ready for actionability, driving visibility with dashboards on the shop floor, pushing automated notifications, monitoring OEE metrics and other critical KPIs, and running workflows to manage shop floor processes. For example, Wiscon Products, a precision parts manufacturer, was able to increase utilization by 30% using machine monitoring.

With accurate, real-time data in hand, a company can benchmark itself to understand the true performance of the operation. Many companies are stunned when the returned data shows them a significantly different picture than what they had assumed was their performance rate.
When using MachineMetrics to benchmark yourself, gaps in performance become immediately visible, and managers can begin to take action to improve utilization. Real-time decision-making also becomes possible. Cycle time, breakdowns, scrap outs, and other information inform managers and operators of what steps to take to reduce downtime and increase run time.
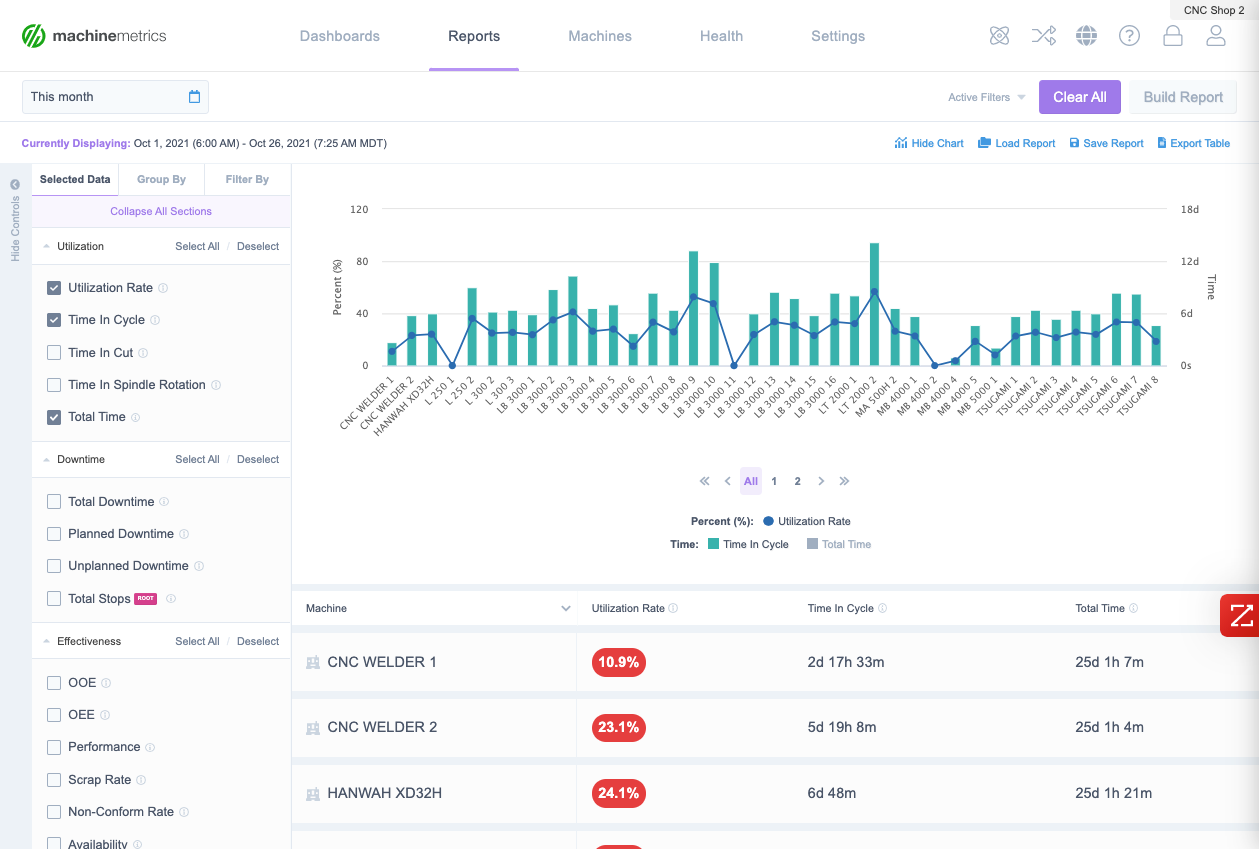
MachineMetrics’ Utilization Report breaks down data even further to capture different visualizations of what is happening at the machine level:
All these views and more are unlocked when machine data is used to tell the story.
 MachineMetrics helps to not only identify your actual utilization but also pinpoint areas for improvement, such as process bottlenecks and downtime reasons.
With control over data and actionable insights that reduce downtime and improve decision-making, many advantages come with higher machine utilization. These include:
MachineMetrics is fully automated and lets you visualize real-time production data on your shop floor. Be notified instantly of problems and use historical analysis and newly revealed trends to improve uptime and create great utilization rates.
Leverage utilization reports to spot issues at the operator, machine, cell, or plant level and drill in to understand what's causing the problem. With an accurate, real-time measure of shop floor performance, you can easily spot opportunities to increase OEE.
Want to see it in action? Book some time with our team today.
Ready to empower your shop floor?
Learn More

.png?width=1960&height=1300&name=01_comp_Downtime-%26-Quality_laptop%20(1).png)


.gif)


Comments