
Book a Demo of MachineMetrics
The leading platform to collect, monitor, analyze, and drive action with machine data. Set up time with a product specialist to learn how we can help your operation.
Ready to empower your shop floor?
Learn More.svg)

Things move quickly in manufacturing. People, materials, machines, and other components are constantly in play with changeovers, unit production, repairs, and other tasks to keep production processes running efficiently.
Managing these fast-paced environments requires accurate data in the form of production reporting. These reports help keep things on track by allowing decision-makers the opportunity to use production data to make decisions on the go. They also help operators and staff from other departments stay on top of current information.
The impact of accurate, real-time production reporting cannot be overstated. With the right solution in place, both operators and managers can get complete visibility into production performance in easy-to-digest reports and dashboards that are made accessible anywhere stakeholders may be.
What is Production Reporting?Production reporting is the process of analyzing, visualizing, and understanding the current and historical performance of a production operation. It includes dashboards, reports, charts, and graphs that make it easier for users to understand key performance indicators (KPIs) as well as to pinpoint weaknesses, such as bottlenecks, unplanned downtime, and poor machine utilization. |
Good production reports will contain data like key production process metrics that show KPIs (such as production rates), finished goods count, quality issues, speed, downtime, and more. An effective report will help managers and staff identify potential problems and craft solutions on the fly.
For departments outside the shop floor - like planning, inventory control, maintenance, and finance - production reporting tools help measure the progress that informs them of the best way to complete their tasks.
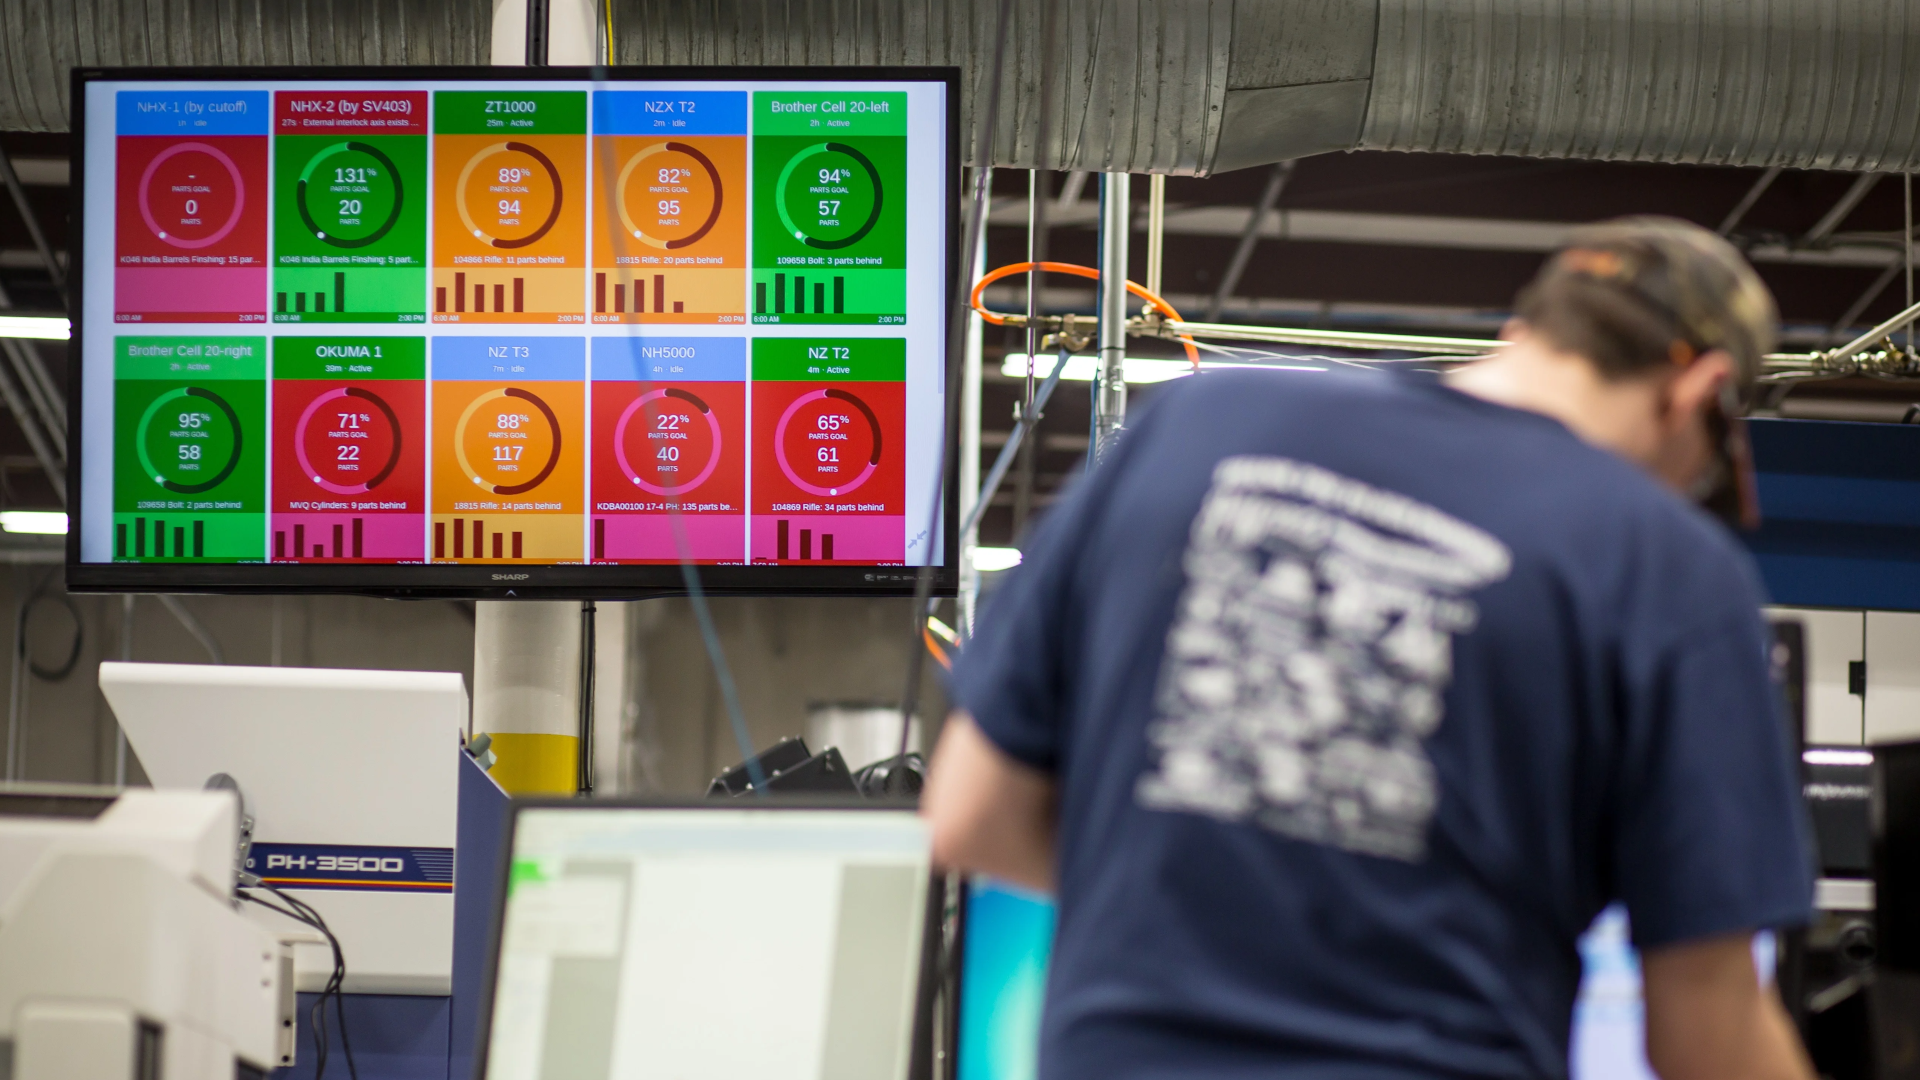
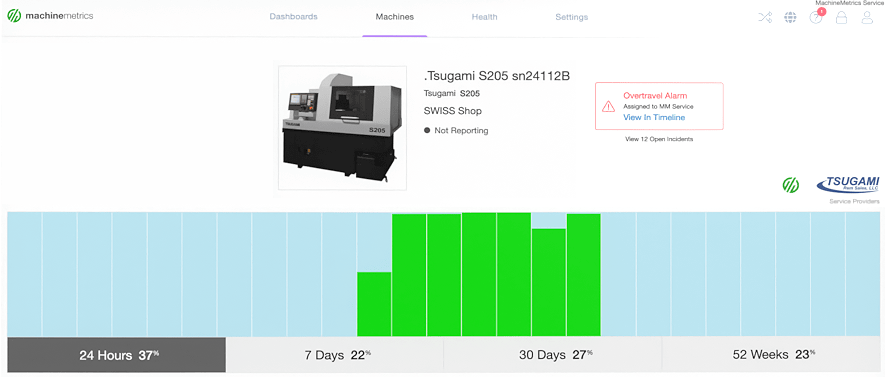
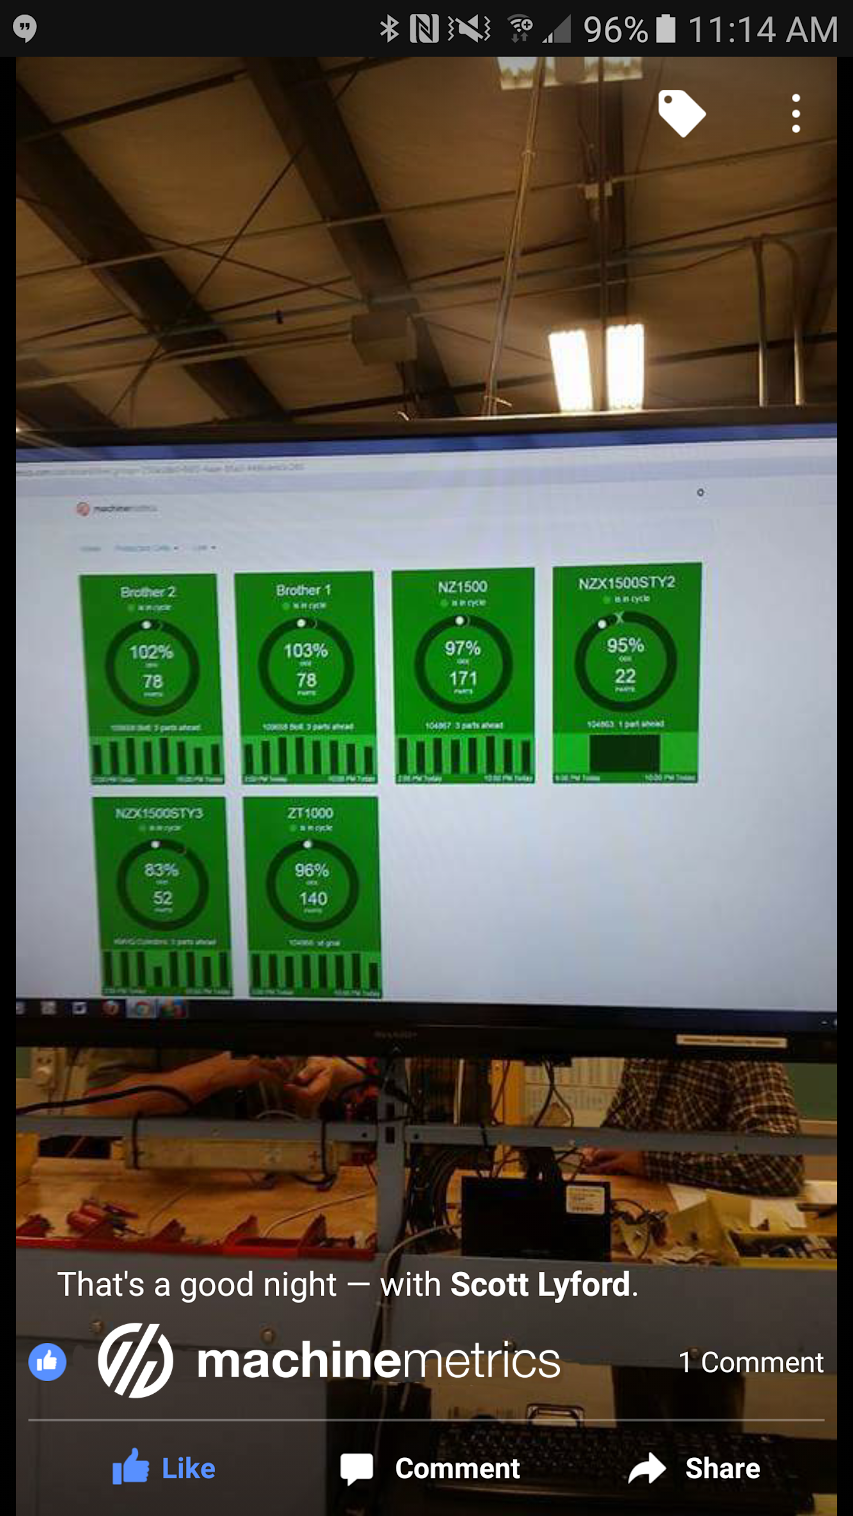
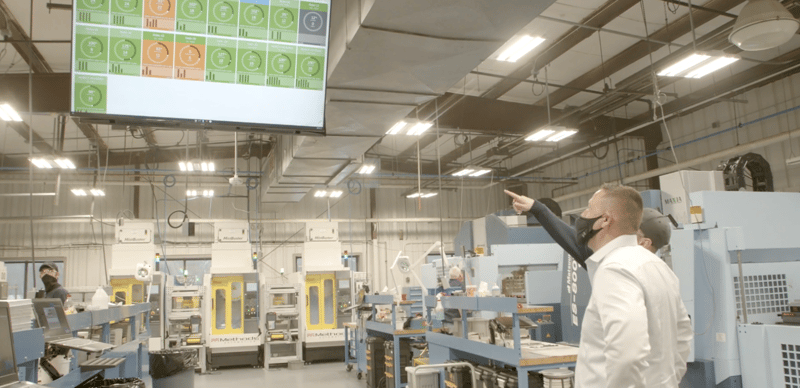 A MachineMetrics customer analyzes production performance on a real-time shop floor dashboard. In this instance, the manager can easily see what machines are falling behind in expected part counts.
Traditional production reporting used data that was delayed by compilation and rationalization. It required human analysis and often contained errors that moved along the system as information was reported. Because it was so time-consuming, users regularly created ad hoc reports to review specific details, only to repeat the process as the next challenge arose.
Today, production reporting and other operational reports are highly automated. This automated reporting enables companies to generate reports that reflect accurate data and visibility on the shop floor.
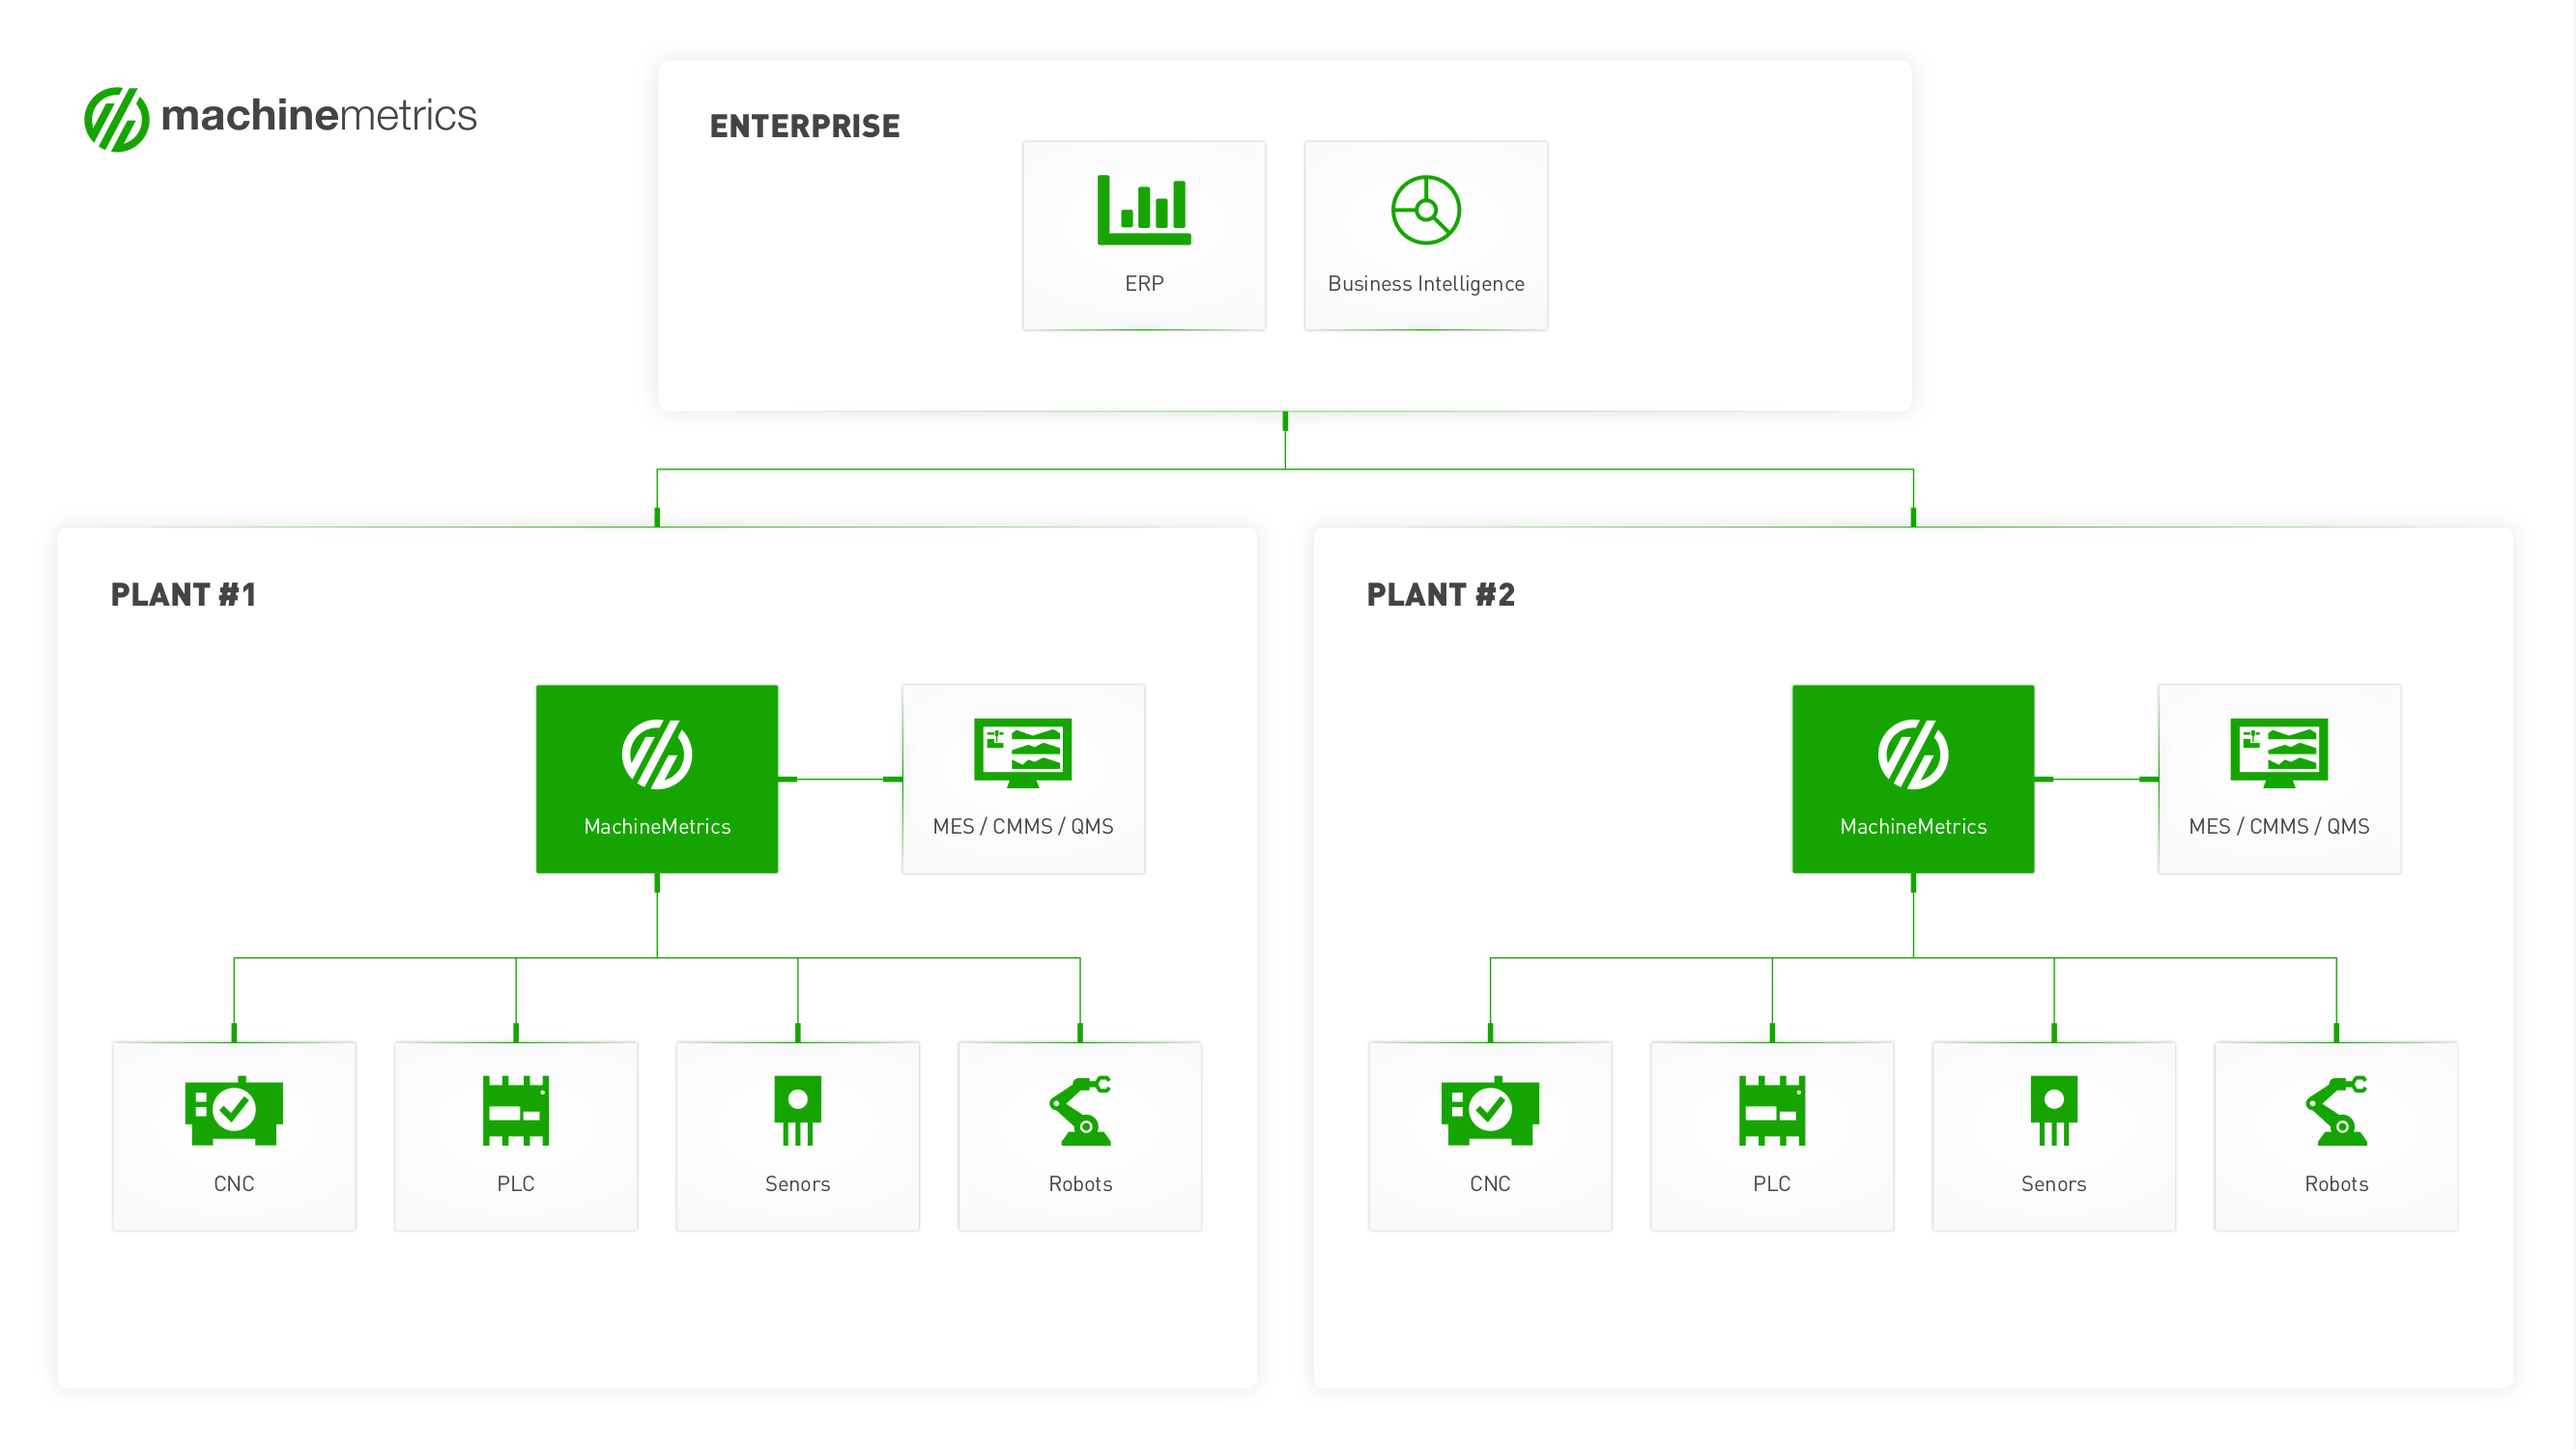
MachineMetrics achieves accurate, real-time reporting by connecting directly to equipment. This surfaces accurate production data that is visualized in pre-built (or custom) dashboards and reports within the platform.
What should be included in a production report?
Real-time manufacturing reports allow staff to act quickly. Operations are more effective because users have the information they need in the format that fits their job. Today, these reports are less likely to be paper-printed and instead exist within intuitive and customizable dashboards where users can configure them to their needs or toggle between views.
Here are a few benefits of real-time manufacturing reporting:
Real-time production reporting uses machine data as it’s generated at the point of production. This data is then structured and analyzed to provide accurate reports customized to the user’s needs. This standardization of data increases visibility across the production floor, so operators and managers have complete visibility into the entire process or process by department.
As Matt Townsend, Senior Director of Manufacturing Strategy at Paragon Medical says, "It gets everyone in the operation speaking the same language, from area to area, to site to site, and even at an enterprise level. We all know how our machines are running." Read the full story.
Manual data collection, rationalization, and human error are eliminated in real-time production reporting because it uses captured data from connected devices at the machine level. This ensures that the reports are accurate when they reach the hands of those who need them.
Managers can better plan labor, understand equipment utilization, measure progress, and implement improvements because the report is current and accurate. Operators can respond quickly and identify trends that require intervention by management or maintenance.
For example, managers can be notified immediately of a machine downtime event in order to respond to the problem as fast as possible.
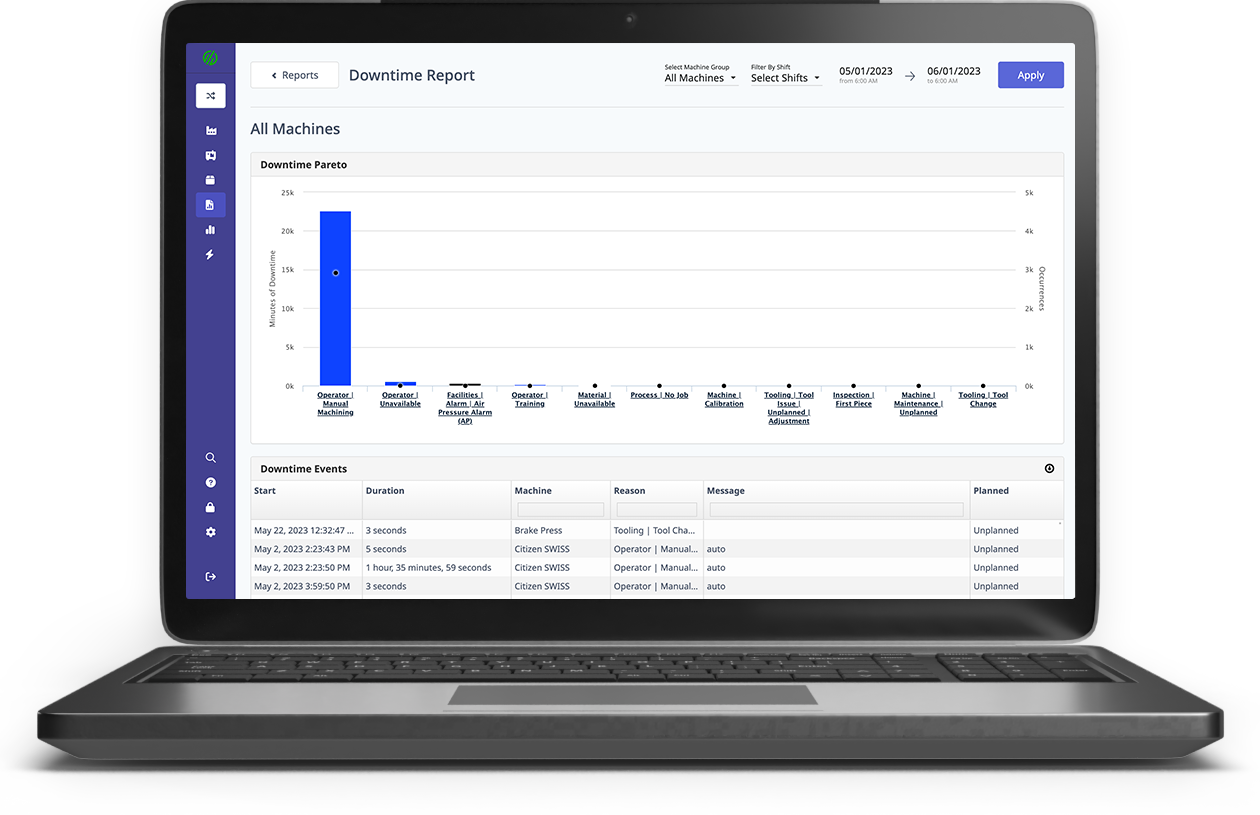
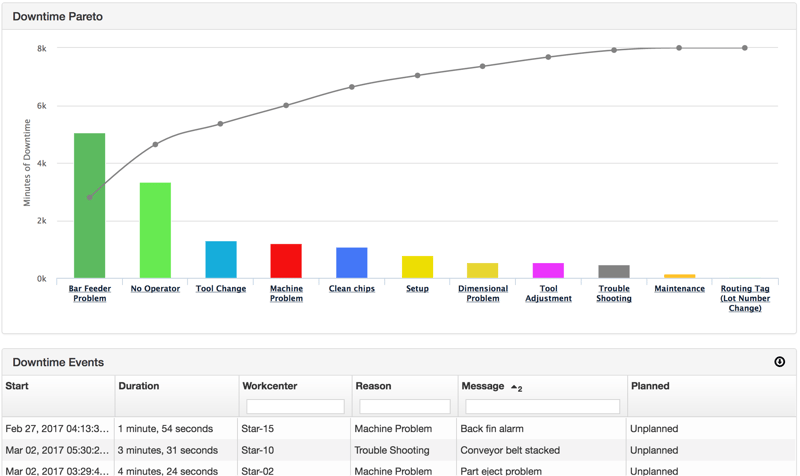 Downtime Pareto reports help users easily identify the most costly reasons for machine downtimes. This enables managers to adjust processes to prevent downtimes from ever occurring in the first place.
Real-time data means the ability to turn production reporting into a dynamic tool. Users can view production history by week, shift, hour, machine, spindle, and operator, allowing them to easily access the information they need. This agility in real-time shows the true picture of what’s happening on the shop floor.
These reports are also flexible because they’re accessible across the enterprise at any level. A meeting of executives making decisions about future production targets or equipment procurement has the same access to what the operator is seeing with the option to “zoom-out” and understand the bigger picture.
While critical metrics make up the heart of real-time production reporting, the data benefits from actionable insights due to real-time analytics. In traditional reporting, operators and technicians didn’t have the luxury of seeing a trend in production as it was happening.
With real-time production monitoring, insights, trends, and other information can be displayed in Pareto charts, graphs, and other formats to show them where the problems are. Intervention is faster, and there’s a greater chance to identify an opportunity to implement continuous improvement that, in traditional reporting, would have gone undetected as the event passed.
Further, the data analyzed in production reporting can be used to drive automation. For example, in the case that a machine typically experiences a failure at a given threshold of parts. A notification could be set up to notify the maintenance team to perform maintenance on the equipment to prevent downtime.
With an extensible platform like MachineMetrics, you could actually create work orders automatically within a CMMS.
Metrics and critical KPIs are the bread and butter of good production reporting. MachineMetrics’ production monitoring solution offers many out-of-the-box reporting categories that can be customized by metric to fit a user’s department, factory, or business model.
There are several metrics available for production efficiency reporting. For those conscious of per hour production rates, total part-time, expected part time, actual part time, and ideal part time can be used to establish production rate targets by the hour, shift, day, or week.
For companies with low volume and high SKUs, efficiency metrics may also include setup time and be measured by expected versus total setup time. Downtime can further be measured alongside expected, ideal, and average part time per hour.
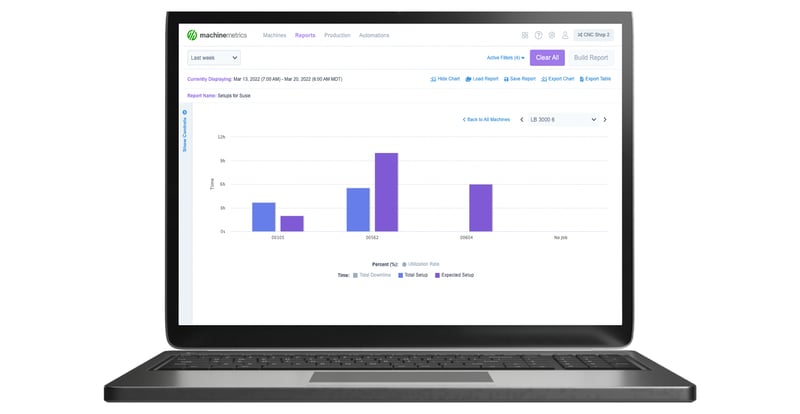 Analyzing expected vs actual setup times in MachineMetrics.
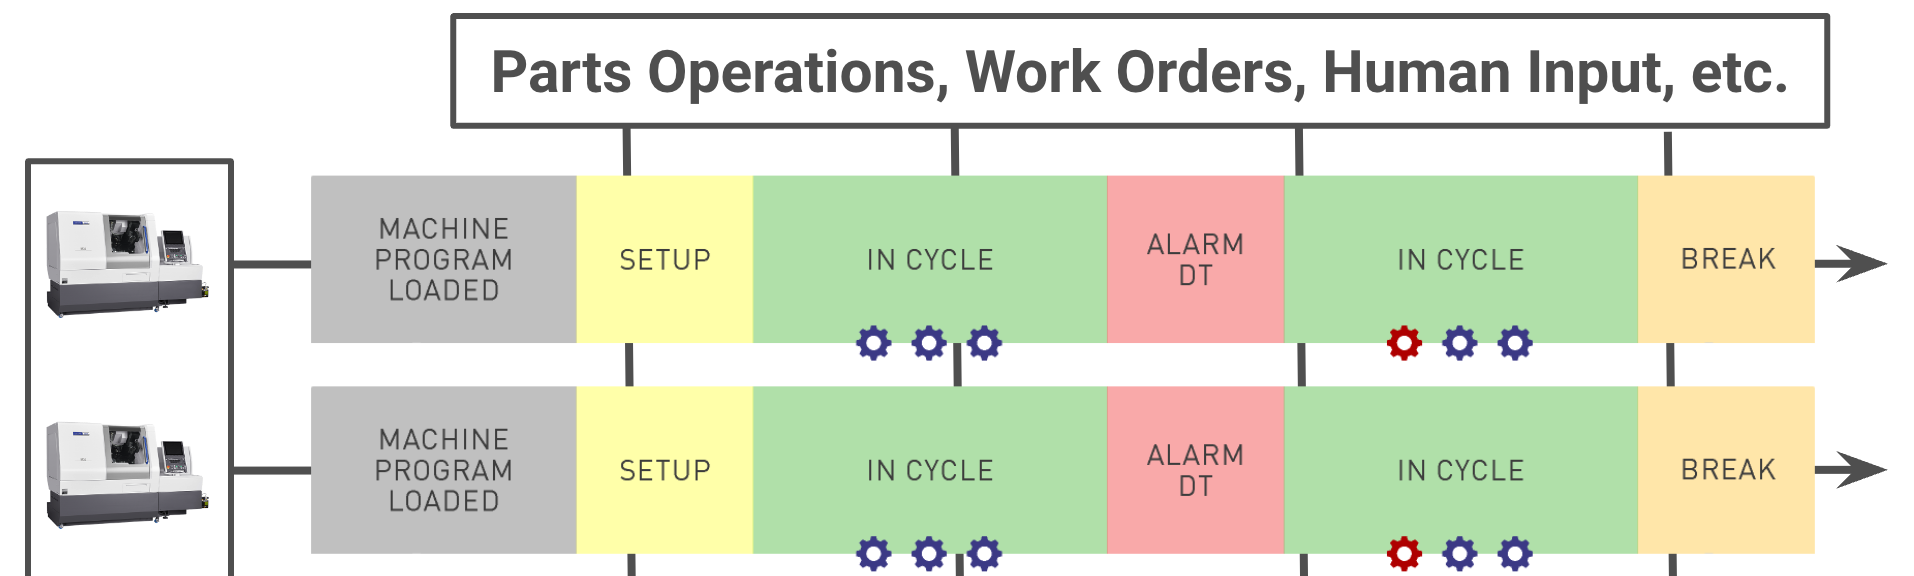
Measuring downtime by cause is an integral part of a manufacturing operation. The less downtime, the more productivity and capacity are available for production. Metrics may include total downtime, planned downtime, and unplanned downtime.
The distinction between planned and unplanned downtime allows decisions on operational efficiency in two directions. Planned downtime, such as changeover and scheduled maintenance, can be managed to improve time stopped, and those process improvements are included in SOPs to enhance operational efficiency.
Unplanned downtime is the maintenance breakdowns, jams, stops, faults, and other operational mishaps that occur over time. Tracking, understanding, and classifying this type of downtime by cause - using Pareto charts, graphs, and other tools - helps managers target common problems for continuous improvement initiatives.
Learn how you can run a downtime analysis using production data.
As one of the highest long-term costs for any company, measuring and reporting equipment effectiveness is vital to success.
Metrics that may be included in automated production reporting include Overall Equipment Effectiveness (OEE), Overall Operations Effectiveness (OOE), and Total Effective Equipment Performance (TEEP).
Production effectiveness may also include metrics that help manage resources, such as planning, scheduling, and labor utilization. These metrics include availability, performance, and quality measures such as reject rate, scrap rate, and Non-Conform Rates. These can affect a company’s compliance requirements in industries like medical and aerospace.
A common category for any manufacturer is part production. Far from simple counts and totals, part production provides vital insight into how production is performing against order position, sales targets, or demand.
Common reports are total parts versus good parts, rejected parts, and scrapped parts. Rejected and non-conforming parts may be unworkable, but this requires additional labor. Having them included in a production report lets managers know what time and resources must be diverted to bring these parts into spec.
Production reporting is as old as manufacturing. But with MachineMetrics, you can unlock real-time data collection straight from equipment. This ensures the information presented to operators and managers is accurate and up-to-date.
MachineMetrics also realizes that while every manufacturing operation needs the basics, not every manufacturing operation requires the same information. Our out-of-the-box reports can deliver immediate benefits to get reporting up to date and available to those who need it. Our production reports are also highly customizable to individual operations, allowing custom reports that deliver dynamic real-time reporting from the facility to the spindle level.
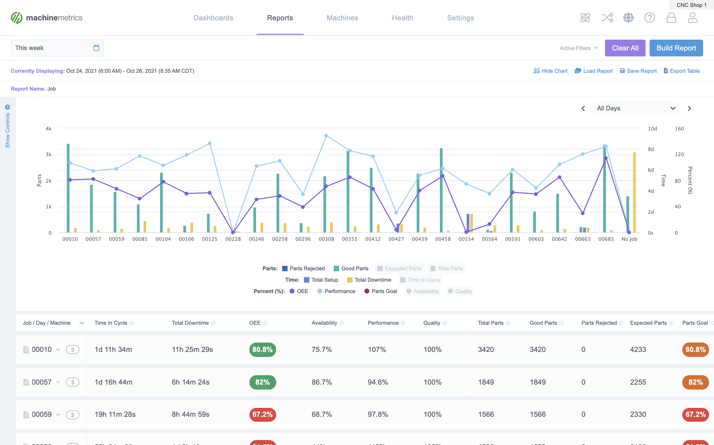
For example, above is a look at our production report builder. This enables users to select whichever metrics they would like to build customized reports that answer their most pressing questions.
Once configured, MachineMetrics reports are available via multiple devices such as HMIs, PCs, tablets, and phones to bring the power of real-time production reporting to all stakeholders, wherever they may be.
Ready to empower your shop floor?
Learn More

.png?width=1960&height=1300&name=01_comp_Downtime-%26-Quality_laptop%20(1).png)

Comments